“ Bullishness is at a near record. ”
Bullish sentiment among short-term market timers is at near-record levels. Followers of contrarian analysis believe the most likely near-term trend of the market from here is down.
You might be surprised to learn that bullishness is so strong. That’s why it’s important to rely on objective indicators rather than our memories when placing the current optimism in an historical context. We’re not immune to the mood swings we’re trying to measure. We’re like the fish who has to jump out of the ocean to understand what water is.
For example, when in recent days I’ve asked clients who don’t have access to my firm’s sentiment indicators, they guess that bullish sentiment has grown modestly over the past six- to nine months. In fact, it has swung from near-record bearishness last October to near-record bullishness.
Consider the average recommended stock market exposure level among a subset of short-term stock market timing newsletters. (This is what’s measured by the Hulbert Stock Newsletter Sentiment Index, or HSNSI.) At the market’s low last Oct. 12, the HSNSI stood at the 0.08th percentile of all daily readings since 2000. Today it’s at the 99.99th percentile.
The S&P 500 SPX, +0.24% on a total return basis is now more than 25% higher than where it stood at its October low. Though contrarians aren’t necessarily expecting a decline of similar magnitude, they believe that the odds favor a decline.
AI bubble trouble
The bubble-like behavior of stocks even remotely associated with artificial intelligence (AI) has led some to wonder how current sentiment compares to the top of the internet bubble in March 2000. The chart below provides an answer.
The chart plots the HSNSI over about three months of U.S. market trading days. The orange line reflects sentiment in the weeks leading up to the top of the internet bubble, while the gray line reflects sentiment over the weeks prior to now.
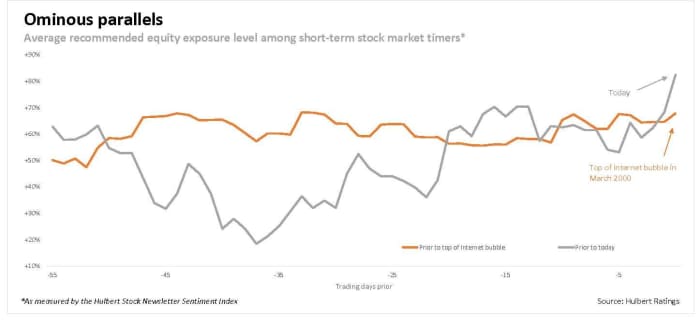
Notice that over the right third of the chart (reflecting about one month) the two lines track each other relatively closely. That’s ominous, since it means that bullishness today is running just as high as it was at the top of the Internet bubble.
The only bright spot is in the first two-thirds of the chart, during which the orange line was consistently higher than the gray line. This suggests that bullishness in early 2000 remained persistently higher for a longer period than we’ve seen in recent weeks. That seems a rather thin reed for the bulls to hang onto.
The bulls’ best hope, from a contrarian point of view, would be for the stock market to fall sufficiently in coming days for investors to begin rebuilding a robust wall of worry — thereby providing a foundation for a bigger advance later. It would be a bad sign, in contrast, for the market to struggle higher, propelling bullish sentiment into even more uncharted waters.
Mark Hulbert is a regular contributor to MarketWatch. His Hulbert Ratings tracks investment newsletters that pay a flat fee to be audited. He can be reached at mark@hulbertratings.com
More: Top investment newsletters are down on tech, Tesla and Meta Platforms. Here’s what they like.
Also read: Stocks are overbought, yes, but don’t sell yet