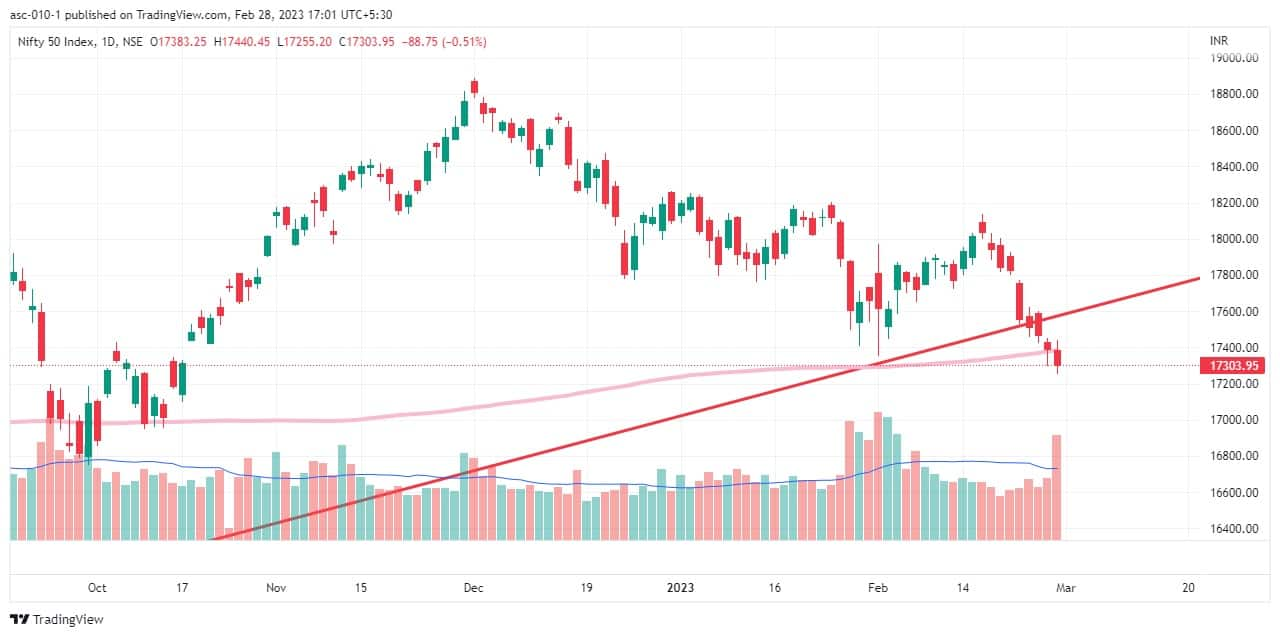
The Nifty closed in the red yet again on February 28, extending losses for the eighth session in a row and also ending the month 2 percent down.
The index opened lower at 17,383 but made some recovery only to squander the gains amid volatility. It dropped to the day’s low of 17,255 in the afternoon but narrowed the losses in the last hour of trade, closing 89 points down at 17,304.
It formed a bearish candlestick on the daily charts, making lower highs and lower lows for the ninth session in a row.
The index also closed below its 200-day moving average (DMA) of 17,383 as well as the budget day low of 17,353, which is worrying market participants. This was the first time in 20 weeks that the index settled below 200 DMA. The last time it was on October 11, 2022.
On the monthly scale, the index lost more than 2 percent and formed a big bearish candle for the third straight month. The index, which hit a record high of 18,887 on December 1, is down 1,600 points in three months.
Considering the consistent selling pressure and the momentum indicator relative strength index (RSI) approaching the 30 mark, the market is looking oversold now.
Experts hence still expect some reversal in coming sessions but if the index stays below 200 DMA, it can drop slide further to 17,200-17,100, the said.
“Intraday traders can look for long opportunities only above the resistance level of 17,400 & the price should sustain above 17,400 for 15 minutes to confirm long,” Rohan Shah, Head of Technical Analyst at Stoxbox, said.
Traders can look for fresh shorts only if the Nifty breaks the 17,250 level and remains below for 15 minutes to confirm short, he said.
On the options front, the maximum weekly Call open interest was reflected in 17,400 strike followed by 17,500 and 17,600 strike, with Call writing at 17,400 strike, then 17,300 and 17,500 strikes.
On the Put side, the maximum open interest was at 17,000 strike followed by 17,300 strike and 17,200 strike, with writing at 17,300 strike then 17,100 strike.
The data indicates that 17,000 is expected to be critical support, whereas 17,400 is likely to be the near-term resistance and 17,600 may act as a sharp reversal point.
The volatility index (VIX) climbed for the first time in four sessions, rising 1.04 percent to 14.02 levels from 13.88 levels, adding to the discomfort.
Banking index
The Bank Nifty opened flat at 40,303 and consolidated in the 40,073-40,391 range. It closed 38 points lower at 40,269 and formed a Doji pattern on the daily charts, indicating indecisiveness among buyers and sellers about the trend.
“The index support stands at 39,700 and the resistance is visible at 40,300. A break on either side will lead to trending moves. The index within the range remains in a buy-on-dip mode, with support at 39,700,” Kunal Shah, Senior Technical Analyst, LKP Securities, said.
Disclaimer: The views and investment tips expressed by experts on Moneycontrol.com are their own and not those of the website or its management. Moneycontrol.com advises users to check with certified experts before taking any investment decisions.