Experts feel the 17,800-18,200 range is expected to break on either side after the announcement of the Budget, hence, if the Nifty breaks 18,200, then 18,500 is the level to watch out for
Sunil Shankar Matkar
January 23, 2023 / 09:11 AM IST

Stock-specific action is expected to continue this week, given the ongoing corporate earnings season and the Budget expectations
‘);
$ (‘#lastUpdated_’+articleId).text(resData[stkKey][‘lastupdate’]);
//if(resData[stkKey][‘percentchange’] > 0){
// $ (‘#greentxt_’+articleId).removeClass(“redtxt”).addClass(“greentxt”);
// $ (‘.arw_red’).removeClass(“arw_red”).addClass(“arw_green”);
//}else if(resData[stkKey][‘percentchange’] < 0){
// $ (‘#greentxt_’+articleId).removeClass(“greentxt”).addClass(“redtxt”);
// $ (‘.arw_green’).removeClass(“arw_green”).addClass(“arw_red”);
//}
if(resData[stkKey][‘percentchange’] >= 0){
$ (‘#greentxt_’+articleId).removeClass(“redtxt”).addClass(“greentxt”);
//$ (‘.arw_red’).removeClass(“arw_red”).addClass(“arw_green”);
$ (‘#gainlosstxt_’+articleId).find(“.arw_red”).removeClass(“arw_red”).addClass(“arw_green”);
}else if(resData[stkKey][‘percentchange’] < 0){
$ (‘#greentxt_’+articleId).removeClass(“greentxt”).addClass(“redtxt”);
//$ (‘.arw_green’).removeClass(“arw_green”).addClass(“arw_red”);
$ (‘#gainlosstxt_’+articleId).find(‘.arw_green’).removeClass(“arw_green”).addClass(“arw_red”);
}
$ (‘#volumetxt_’+articleId).show();
$ (‘#vlmtxt_’+articleId).show();
$ (‘#stkvol_’+articleId).text(resData[stkKey][‘volume’]);
$ (‘#td-low_’+articleId).text(resData[stkKey][‘daylow’]);
$ (‘#td-high_’+articleId).text(resData[stkKey][‘dayhigh’]);
$ (‘#rightcol_’+articleId).show();
}else{
$ (‘#volumetxt_’+articleId).hide();
$ (‘#vlmtxt_’+articleId).hide();
$ (‘#stkvol_’+articleId).text(”);
$ (‘#td-low_’+articleId).text(”);
$ (‘#td-high_’+articleId).text(”);
$ (‘#rightcol_’+articleId).hide();
}
$ (‘#stk-graph_’+articleId).attr(‘src’,’//appfeeds.moneycontrol.com/jsonapi/stocks/graph&format=json&watch_app=true&range=1d&type=area&ex=’+stockType+’&sc_id=’+stockId+’&width=157&height=100&source=web’);
}
}
}
});
}
$ (‘.bseliveselectbox’).click(function(){
$ (‘.bselivelist’).show();
});
function bindClicksForDropdown(articleId){
$ (‘ul#stockwidgettabs_’+articleId+’ li’).click(function(){
stkId = jQuery.trim($ (this).find(‘a’).attr(‘stkid’));
$ (‘ul#stockwidgettabs_’+articleId+’ li’).find(‘a’).removeClass(‘active’);
$ (this).find(‘a’).addClass(‘active’);
stockWidget(‘N’,stkId,articleId);
});
$ (‘#stk-b-‘+articleId).click(function(){
stkId = jQuery.trim($ (this).attr(‘stkId’));
stockWidget(‘B’,stkId,articleId);
$ (‘.bselivelist’).hide();
});
$ (‘#stk-n-‘+articleId).click(function(){
stkId = jQuery.trim($ (this).attr(‘stkId’));
stockWidget(‘N’,stkId,articleId);
$ (‘.bselivelist’).hide();
});
}
$ (“.bselivelist”).focusout(function(){
$ (“.bselivelist”).hide(); //hide the results
});
function bindMenuClicks(articleId){
$ (‘#watchlist-‘+articleId).click(function(){
var stkId = $ (this).attr(‘stkId’);
overlayPopupWatchlist(0,2,1,stkId);
});
$ (‘#portfolio-‘+articleId).click(function(){
var dispId = $ (this).attr(‘dispId’);
pcSavePort(0,1,dispId);
});
}
$ (‘.mc-modal-close’).on(‘click’,function(){
$ (‘.mc-modal-wrap’).css(‘display’,’none’);
$ (‘.mc-modal’).removeClass(‘success’);
$ (‘.mc-modal’).removeClass(‘error’);
});
function overlayPopupWatchlist(e, t, n,stkId) {
$ (‘.srch_bx’).css(‘z-index’,’999′);
typparam1 = n;
if(readCookie(‘nnmc’))
{
var lastRsrs =new Array();
lastRsrs[e]= stkId;
if(lastRsrs.length > 0)
{
var resStr=”;
let secglbVar = 1;
var url = ‘//www.moneycontrol.com/mccode/common/saveWatchlist.php’;
$ .get( “//www.moneycontrol.com/mccode/common/rhsdata.html”, function( data ) {
$ (‘#backInner1_rhsPop’).html(data);
$ .ajax({url:url,
type:”POST”,
dataType:”json”,
data:{q_f:typparam1,wSec:secglbVar,wArray:lastRsrs},
success:function(d)
{
if(typparam1==’1′) // rhs
{
var appndStr=”;
//var newappndStr = makeMiddleRDivNew(d);
//appndStr = newappndStr[0];
var titStr=”;var editw=”;
var typevar=”;
var pparr= new Array(‘Monitoring your investments regularly is important.’,’Add your transaction details to monitor your stock`s performance.’,’You can also track your Transaction History and Capital Gains.’);
var phead =’Why add to Portfolio?’;
if(secglbVar ==1)
{
var stkdtxt=’this stock’;
var fltxt=’ it ‘;
typevar =’Stock ‘;
if(lastRsrs.length>1){
stkdtxt=’these stocks’;
typevar =’Stocks ‘;fltxt=’ them ‘;
}
}
//var popretStr =lvPOPRHS(phead,pparr);
//$ (‘#poprhsAdd’).html(popretStr);
//$ (‘.btmbgnwr’).show();
var tickTxt =’‘; if(typparam1==1) { var modalContent = ‘Watchlist has been updated successfully.’; var modalStatus = ‘success’; //if error, use ‘error’ $ (‘.mc-modal-content’).text(modalContent); $ (‘.mc-modal-wrap’).css(‘display’,’flex’); $ (‘.mc-modal’).addClass(modalStatus); //var existsFlag=$ .inArray(‘added’,newappndStr[1]); //$ (‘#toptitleTXT’).html(tickTxt+typevar+’ to your watchlist’); //if(existsFlag == -1) //{ // if(lastRsrs.length > 1) // $ (‘#toptitleTXT’).html(tickTxt+typevar+’already exist in your watchlist’); // else // $ (‘#toptitleTXT’).html(tickTxt+typevar+’already exists in your watchlist’); // //} } //$ (‘.accdiv’).html(”); //$ (‘.accdiv’).html(appndStr); } }, //complete:function(d){ // if(typparam1==1) // { // watchlist_popup(‘open’); // } //} }); }); } else { var disNam =’stock’; if($ (‘#impact_option’).html()==’STOCKS’) disNam =’stock’; if($ (‘#impact_option’).html()==’MUTUAL FUNDS’) disNam =’mutual fund’; if($ (‘#impact_option’).html()==’COMMODITIES’) disNam =’commodity’; alert(‘Please select at least one ‘+disNam); } } else { AFTERLOGINCALLBACK = ‘overlayPopup(‘+e+’, ‘+t+’, ‘+n+’)’; commonPopRHS(); /*work_div = 1; typparam = t; typparam1 = n; check_login_pop(1)*/ } } function pcSavePort(param,call_pg,dispId) { var adtxt=”; if(readCookie(‘nnmc’)){ if(call_pg == “2”) { pass_sec = 2; } else { pass_sec = 1; } var postfolio_url = ‘https://www.moneycontrol.com/portfolio_new/add_stocks_multi.php?id=’+dispId; window.open(postfolio_url, ‘_blank’); } else { AFTERLOGINCALLBACK = ‘pcSavePort(‘+param+’, ‘+call_pg+’, ‘+dispId+’)’; commonPopRHS(); /*work_div = 1; typparam = t; typparam1 = n; check_login_pop(1)*/ } } function commonPopRHS(e) { /*var t = ($ (window).height() – $ (“#” + e).height()) / 2 + $ (window).scrollTop(); var n = ($ (window).width() – $ (“#” + e).width()) / 2 + $ (window).scrollLeft(); $ (“#” + e).css({ position: “absolute”, top: t, left: n }); $ (“#lightbox_cb,#” + e).fadeIn(300); $ (“#lightbox_cb”).remove(); $ (“body”).append(”);
$ (“#lightbox_cb”).css({
filter: “alpha(opacity=80)”
}).fadeIn()*/
$ (“.linkSignUp”).click();
}
function overlay(n)
{
document.getElementById(‘back’).style.width = document.body.clientWidth + “px”;
document.getElementById(‘back’).style.height = document.body.clientHeight +”px”;
document.getElementById(‘back’).style.display = ‘block’;
jQuery.fn.center = function () {
this.css(“position”,”absolute”);
var topPos = ($ (window).height() – this.height() ) / 2;
this.css(“top”, -topPos).show().animate({‘top’:topPos},300);
this.css(“left”, ( $ (window).width() – this.width() ) / 2);
return this;
}
setTimeout(function(){$ (‘#backInner’+n).center()},100);
}
function closeoverlay(n){
document.getElementById(‘back’).style.display = ‘none’;
document.getElementById(‘backInner’+n).style.display = ‘none’;
}
stk_str=”;
stk.forEach(function (stkData,index){
if(index==0){
stk_str+=stkData.stockId.trim();
}else{
stk_str+=’,’+stkData.stockId.trim();
}
});
$ .get(‘//www.moneycontrol.com/techmvc/mc_apis/stock_details/?classic=true&sc_id=’+stk_str, function(data) {
stk.forEach(function (stkData,index){
$ (‘#stock-name-‘+stkData.stockId.trim()+’-‘+article_id).text(data[stkData.stockId.trim()][‘nse’][‘shortname’]);
});
});
function redirectToTradeOpenDematAccountOnline(){
if (stock_isinid && stock_tradeType) {
window.open(`https://www.moneycontrol.com/open-demat-account-online?classic=true&script_id=$ {stock_isinid}&ex=$ {stock_tradeType}&site=web&asset_class=stock&utm_source=moneycontrol&utm_medium=articlepage&utm_campaign=tradenow&utm_content=webbutton`, ‘_blank’);
}
} The market ended a volatile week on a positive note on January 20, and sustained an upward swing for the the second straight week, with the Nifty taking support at the psychological 18,000 mark.The index remained rangebound and formed a Doji candle for yet another week on the weekly scale with a higher-high-higher-low formation, as the closing was near its opening level, indicating indecisiveness among buyers and sellers about future market trend.The index closed with 71 points gains at 18,028 for last week and has overall been consolidating within a tight range of 17,800-18,200 especially amid quarterly earnings and ahead of the Union Budget scheduled to be tabled in Parliament by the finance minister on February 1.Experts feel the above range is expected to break on either side after the announcement of the Budget, hence, if the index breaks 18,200, then 18,500 is the level to watch out for as crossing it could bring a sharp upside, whereas the downside could be up to 17,500 if there is a decisive break of 17,800-17,900 levels.”As far as levels are concerned, the rock-solid support is visible at 17,900 – 17,750 and bulls have till now managed to defend it in a challenging environment. On the flipside, it has become a daunting task to surpass the hurdle of 18,150–18,300,” Sameet Chavan, Chief Analyst-Technical and Derivatives at Angel One, said.The way our markets have undergone a long time-wise correction, he expects the breakout to happen soon from this contracted range.He feels the week beginning today may see some action, although it will be a truncated one as the expiry is advanced by a day on account of the Republic Day on Thursday. “Also, it’s important to understand that we are inching closer to the Union Budget and hence, the market would try to position itself ahead of this mega event,” he said.The stock-specific action is expected to continue in the current week too, given the ongoing corporate earnings season and Budget expectations, experts feel.Let’s take a look at the top 10 trading ideas by experts for the next three-four weeks. Returns are based on the January 20 closing prices:Expert: Subash Gangadharan, Senior Technical & Derivative Analyst at HDFC SecuritiesDabur India: Buy | LTP: Rs 566 | Stop-Loss: Rs 550 | Target: Rs 590 | Return: 4 percentDabur has corrected from a high of Rs 611 touched in December 2022. The stock recently found support around Rs 538 level in January 2023. This is close to the previous intermediate lows, indicating a double bottom formation. The stock has subsequently bounced back and made a higher bottom in the last few sessions.In the process, the stock broke out of a trading range on the back of healthy volumes, which is encouraging. Momentum readings like the 14-day RSI (relative strength index) too have bounced back and are in rising mode now.With the intermediate technical setup too looking positive, we believe the stock has the potential to move higher in the coming weeks. We recommend a buy between Rs 564-568 levels, with a stop-loss at Rs 550 and target of Rs 590.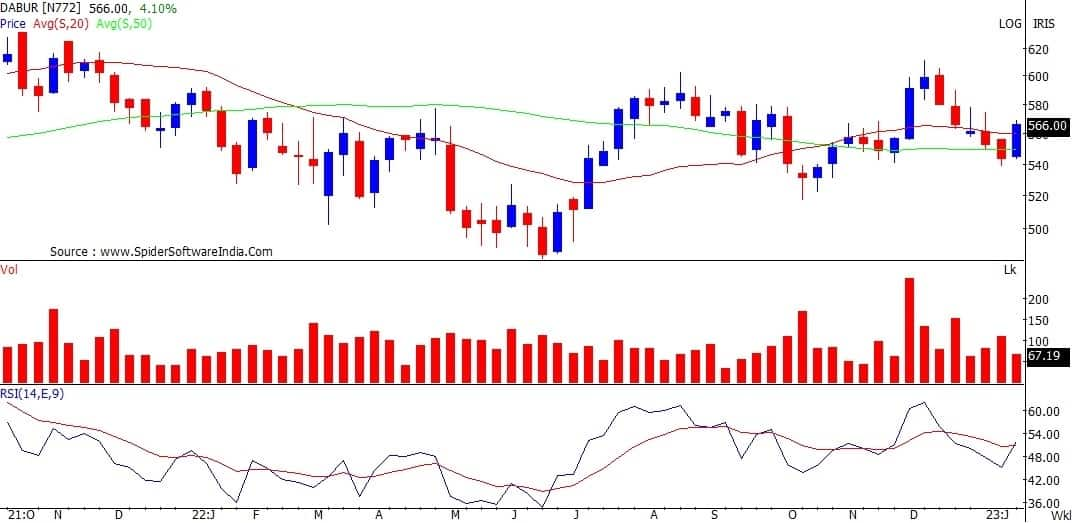 GAIL India: buy | LTP: Rs 99 | Stop-Loss: Rs 96 | Target: Rs 105 | Return: 6 percentAfter correcting from a high of Rs 109 tested in April 2022, GAIL found support around Rs 83 level in September 2022. These are strong supports as they also roughly coincide with previous intermediate lows.The stock has since then been climbing higher and making higher bottoms in the process. This week, the stock also broke out of its recent trading range on the back of above average volumes, indicating it is set to move higher in the coming weeks.Technical indicators are giving positive signals as the stock is trading above the 20 and 50-day SMA (simple moving average). Momentum readings like the 14-week RSI too are in rising mode and not overbought, which implies potential for further upsides.With the intermediate technical setup too looking attractive, we expect the stock to move up towards its previous intermediate highs in the coming weeks. Buy between Rs 97-101 levels, with a stop-loss at Rs 96 and target of Rs 105.
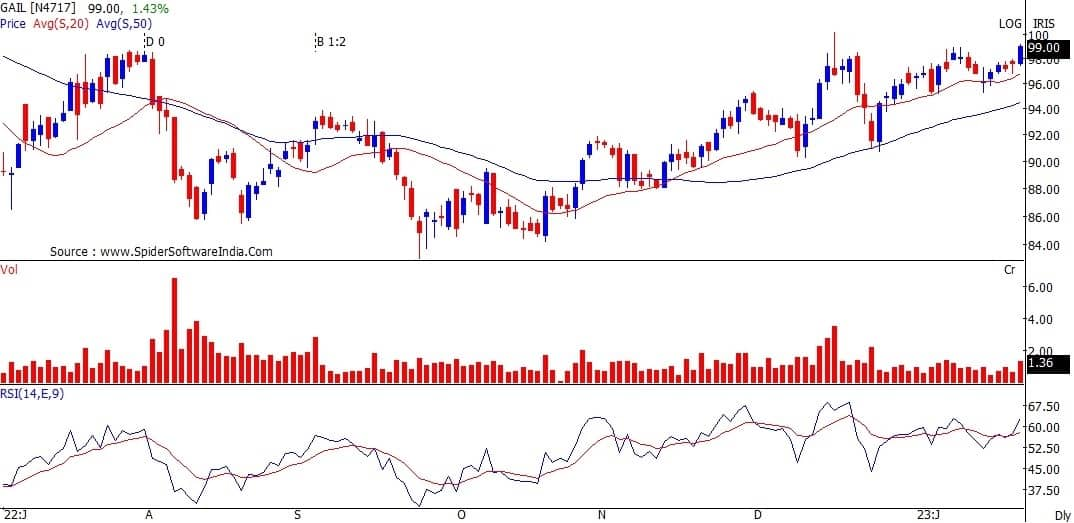 Bajaj Finance: Sell | LTP: Rs 5,860 | Stop-Loss: Rs 6,075 | Target: Rs 5,460 | Return: 7 percentBajaj Finance is in a short term downtrend as it has been making lower tops and lower bottoms for the last several weeks. Recently, the stock broke down below its recent supports after reacting from close to its 50-day SMA. This indicates that the downtrend looks set to continue.Technical indicators are giving negative signals as the stock is now trading below the 20 day and 50 day SMA. Momentum readings like the 14-week RSI are in decline mode and not oversold, which implies potential for more downsides.We therefore expect the stock to correct further in the coming sessions. Sell between Rs 5,855-5,865 levels, with a stop-loss at Rs 6,075 and downside target of Rs 5,460.
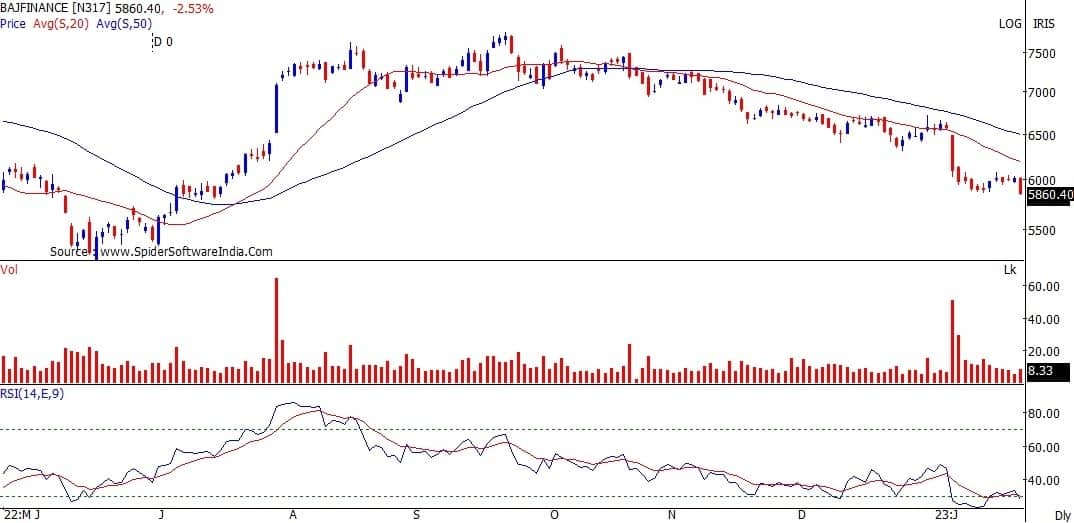 Expert: Shrikant Chouhan, Head of Equity Research (Retail) at Kotak SecuritiesDivis Laboratories: Sell | LTP: Rs 3,343 | Stop-Loss: Rs 3,430 | Target: Rs 3,100 | Return: 7 percentThe stock was forming a rising leg bearish consolidation and the support was at Rs 3,350. On Friday, the stock closed below the level of Rs 3,350.Based on the charts, the stock is heading towards the next supports, which are at Rs 3,250 and Rs 3,100. The stock is trending down and a breakdown of the formation should generate further bearish momentum in the near term. Sell at Rs 3,350-3,400, with a stop-loss of Rs 3,430.
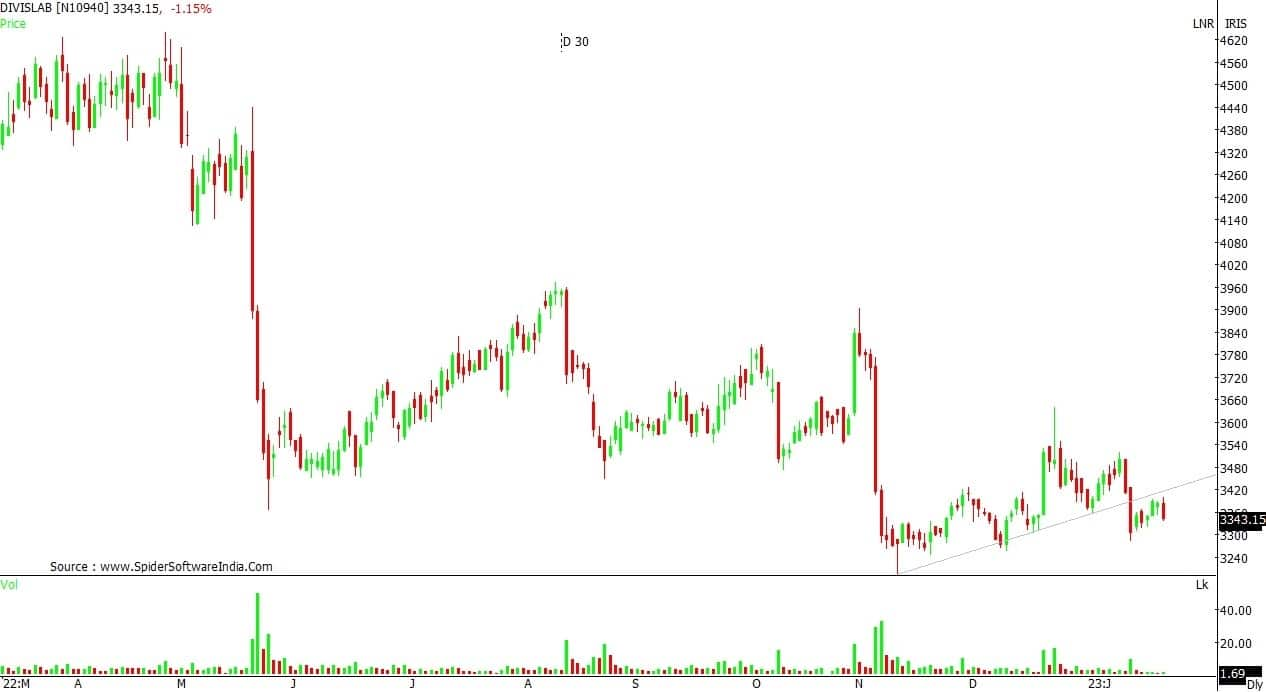 HDFC Bank: Buy | LTP: Rs 1,661 | Stop-Loss: Rs 1,600 | Target: Rs 1,770 | Return: 7 percentThe stock has completed a corrective pattern at Rs 1,560 and has reversed sharply on the back of broad based buying in the private sector bank stocks, which will help the stock to exhibit a trending move in the near term.However, we can be buyers only if it crosses Rs 1,670 or dips towards Rs 1,630. In either case, the stop-loss would be Rs 1,600. Above Rs 1,670 it will find resistance at Rs 1,720 and Rs 1,770.
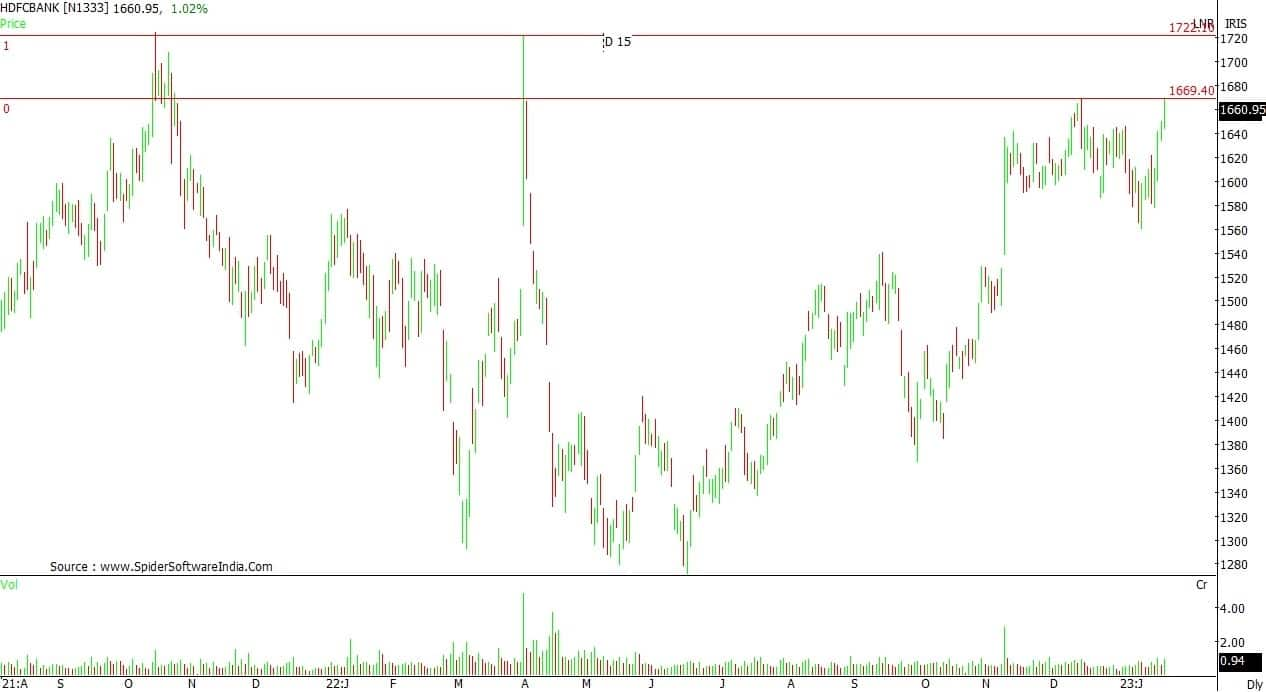 SRF: Buy | LTP: Rs 2,105 | Stop-Loss: Rs 2,000 | Target: Rs 2,500 | Return: 19 percentThe stock is on the verge of completing a corrective pattern. It has displayed a trending movement between the levels of Rs 2,000 to Rs 2,865 during the period July 2022 to September 2022.The corrective pattern is nearing completion between Rs 2,125 to Rs 2,100 levels. It will be an opportunity for traders and investors to invest in the stock from a medium term perspective. On the upside, on the reversal it would rally towards Rs 2,400 to Rs 2,500 levels. Keep a stop-loss at Rs 2,000 for holding positional long positions.
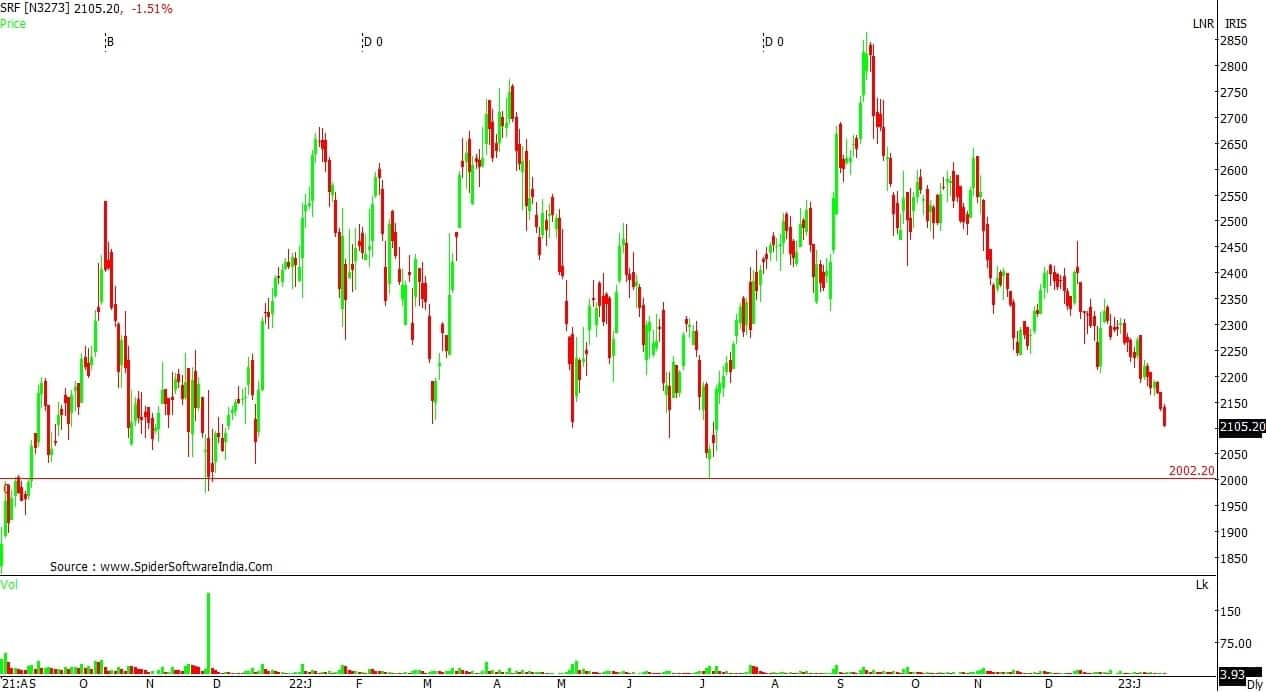 Expert: Jigar S Patel, Senior Manager – Equity Research at Anand RathiMinda Corporation: Buy | LTP: Rs 228 | Stop-Loss: Rs 215 | Target: Rs 260 | Return: 14 percentThe weekly chart of Minda Corporation depicts a perfect symmetrical triangle breakout above Rs 230 mark. The said pattern has a theoretical target of over Rs 300 level. The price action is supported by the positive placement of the weekly RSI which indicates strength in the momentum.Thus, we advise traders to accumulate the stock in the range of Rs 226-230 with a stop-loss of Rs 215 (daily closing basis) for an upside target of Rs 260 on a daily close basis.
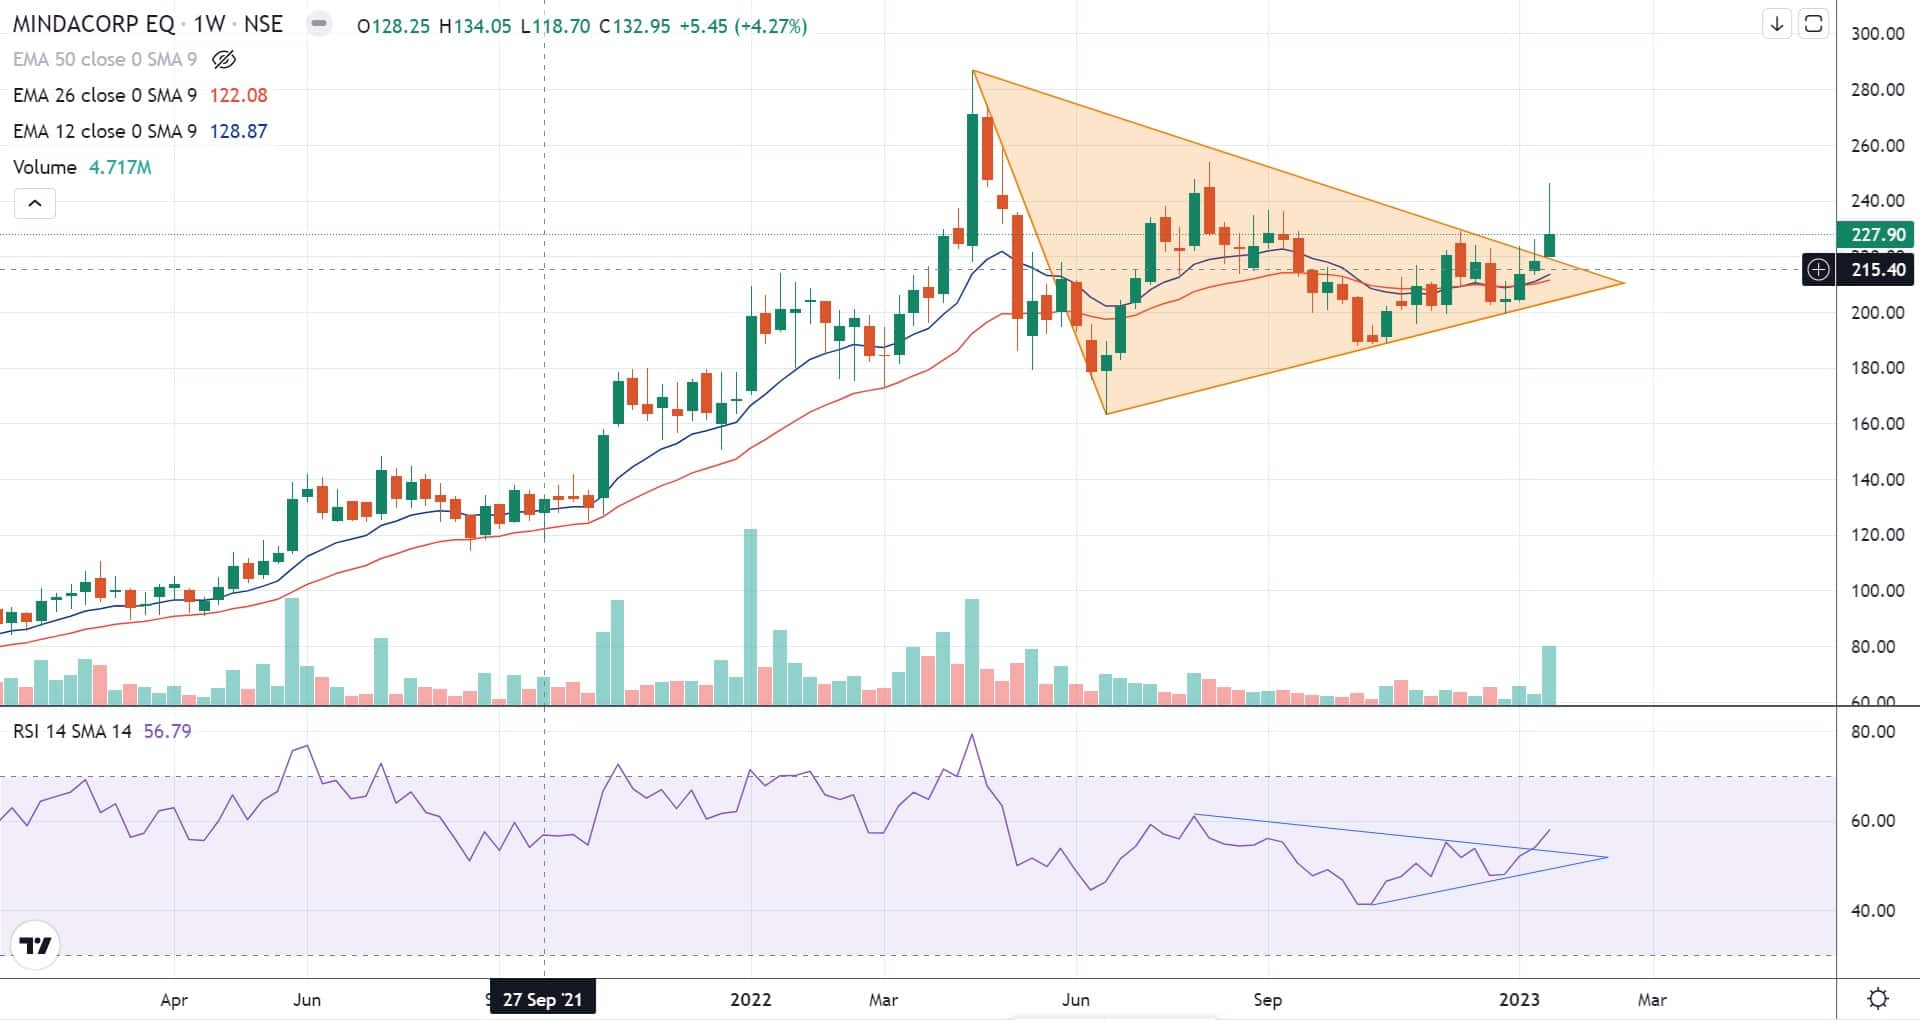 APL Apollo Tubes: Buy | LTP: Rs 1,197 | Stop-Loss: Rs 1,140 | Target: Rs 1,300 | Return: 9 percentThe rally which was started in May 2022 till date resulted in 47 percent appreciation. Currently, it is trading above the 12-21-50 daily exponential moving averages (EMA), which is a sign of strength in the counter.The previous trading session gave a clean breakout from the triangle pattern. On indicator front, daily 14 period RSI has taken support and then it has rebounded thus indicating further up move in APL Apollo Tubes.One can buy around Rs 1,180-1,200 with an expected target of Rs 1,300 and the stop-loss would be Rs 1,140 on a daily close basis.
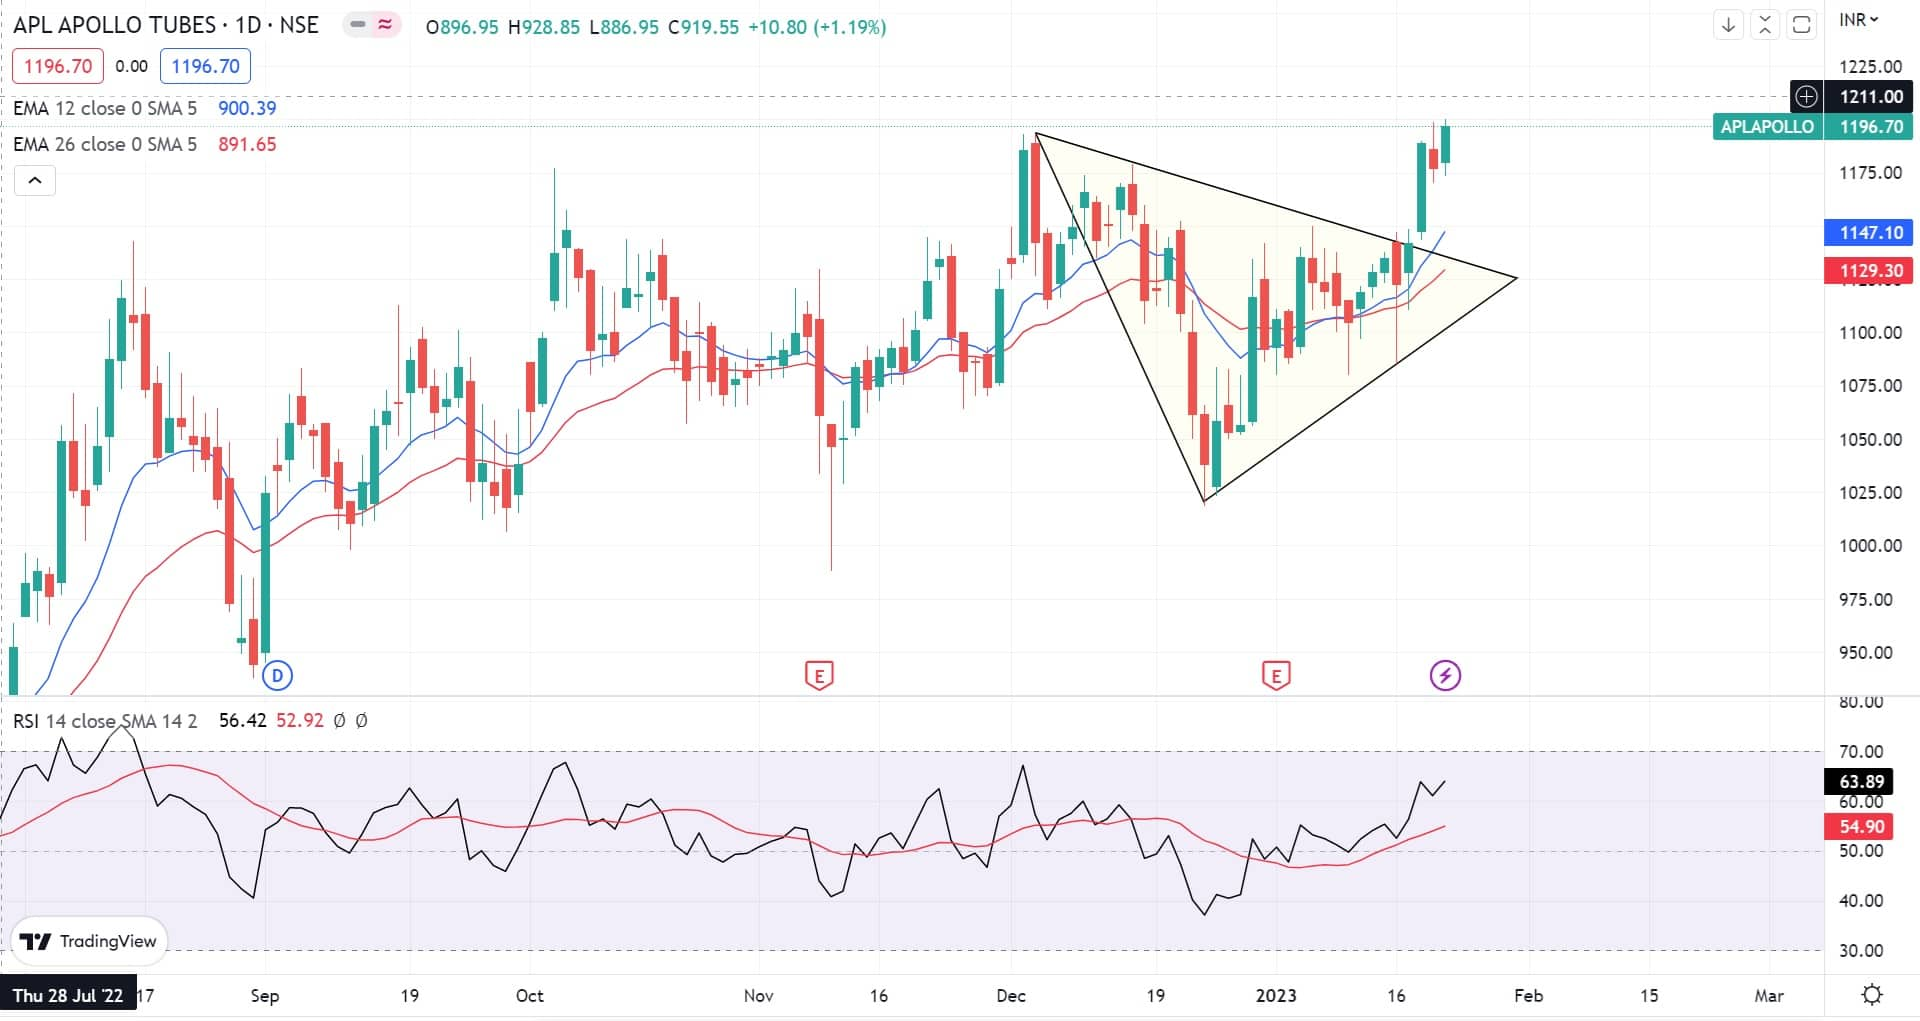 Expert: Mitesh Karwa, Research Analyst at Bonanza PortfolioGNFC: Buy | LTP: Rs 563.5 | Stop-Loss: Rs 590 | Target: Rs 660 | Return: 17 percentThe stock was seen to be retesting a breakout of a rounding bottom formation after five years on the weekly timeframe whereas on the daily timeframe the stock was seen to be taking support from a support zone and bouncing with high volumes which can be used as a confluence towards the bullish view.The 200-day EMA is at around Rs 430 on the weekly timeframe and the stock is expected to be comfortably trading above it. The momentum oscillator RSI (14) is at around 46 showing strength by taking support at lower levels and the supertrend indicator is indicating continuation of the bullish trend.Observation of the above factors indicates that a bullish move is possible in GNFC for target upto Rs 660. One can initiate buy on dip in the range of Rs 620-623 with a stop-loss below Rs 590 on daily closing basis.
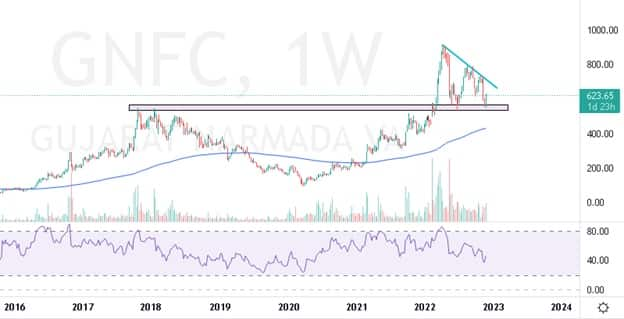 Indoco Remedies: Buy | LTP: Rs 391.5 | Stop-Loss: Rs 372 | Target: Rs 400 | Return: 2 percentIndoco Remedies was seen to be breaking out of a downwards sloping triangle pattern on the weekly timeframe after one and a half years and on the daily timeframe the stock was seen to be making a double bottom formation which can be used as a confluence towards the bullish view.The 200 DEMA is at Rs 321 on the weekly timeframe and the stock is comfortably sustaining above it which is a positive sign.Momentum oscillator RSI (14) is at around 59 on the daily time frame indicating strength by sustaining above 50 and the supertrend indicator is also indicating bullishness. Observation of the above factors indicates that a bullish move in Indoco is possible for target upto Rs 400. One can initiate a buy trade in between the range of Rs 385-387 with stop-loss of Rs 372 on daily closing basis.
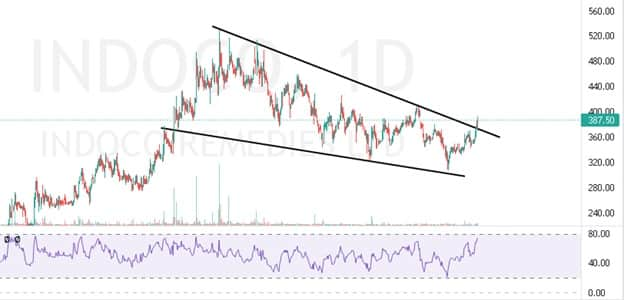 Disclaimer: The views and investment tips expressed by investment experts on Moneycontrol.com are their own and not those of the website or its management. Moneycontrol.com advises users to check with certified experts before taking any investment decisions.