Nifty has reached a good hurdle zone of 16,950. If it manages to sustain above it, then some short-covering can’t be ruled out and 17,140 will be the next level for the index. The immediate support is coming near 16,850, says Vishal Wagh of Bonanza Portfolio.
Vishal Wagh
December 23, 2021 / 07:17 AM IST
‘); $ (‘#lastUpdated_’+articleId).text(resData[stkKey][‘lastupdate’]); //if(resData[stkKey][‘percentchange’] > 0){ // $ (‘#greentxt_’+articleId).removeClass(“redtxt”).addClass(“greentxt”); // $ (‘.arw_red’).removeClass(“arw_red”).addClass(“arw_green”); //}else if(resData[stkKey][‘percentchange’] = 0){ $ (‘#greentxt_’+articleId).removeClass(“redtxt”).addClass(“greentxt”); //$ (‘.arw_red’).removeClass(“arw_red”).addClass(“arw_green”); $ (‘#gainlosstxt_’+articleId).find(“.arw_red”).removeClass(“arw_red”).addClass(“arw_green”); }else if(resData[stkKey][‘percentchange’] 0) { var resStr=”; var url = ‘//www.moneycontrol.com/mccode/common/saveWatchlist.php’; $ .get( “//www.moneycontrol.com/mccode/common/rhsdata.html”, function( data ) { $ (‘#backInner1_rhsPop’).html(data); $ .ajax({url:url, type:”POST”, dataType:”json”, data:{q_f:typparam1,wSec:secglbVar,wArray:lastRsrs}, success:function(d) { if(typparam1==’1′) // rhs { var appndStr=”; var newappndStr = makeMiddleRDivNew(d); appndStr = newappndStr[0]; var titStr=”;var editw=”; var typevar=”; var pparr= new Array(‘Monitoring your investments regularly is important.’,’Add your transaction details to monitor your stock`s performance.’,’You can also track your Transaction History and Capital Gains.’); var phead =’Why add to Portfolio?’; if(secglbVar ==1) { var stkdtxt=’this stock’; var fltxt=’ it ‘; typevar =’Stock ‘; if(lastRsrs.length>1){ stkdtxt=’these stocks’; typevar =’Stocks ‘;fltxt=’ them ‘; } } //var popretStr =lvPOPRHS(phead,pparr); //$ (‘#poprhsAdd’).html(popretStr); //$ (‘.btmbgnwr’).show(); var tickTxt =’‘; if(typparam1==1) { var modalContent = ‘Watchlist has been updated successfully.’; var modalStatus = ‘success’; //if error, use ‘error’ $ (‘.mc-modal-content’).text(modalContent); $ (‘.mc-modal-wrap’).css(‘display’,’flex’); $ (‘.mc-modal’).addClass(modalStatus); //var existsFlag=$ .inArray(‘added’,newappndStr[1]); //$ (‘#toptitleTXT’).html(tickTxt+typevar+’ to your watchlist’); //if(existsFlag == -1) //{ // if(lastRsrs.length > 1) // $ (‘#toptitleTXT’).html(tickTxt+typevar+’already exist in your watchlist’); // else // $ (‘#toptitleTXT’).html(tickTxt+typevar+’already exists in your watchlist’); // //} } //$ (‘.accdiv’).html(”); //$ (‘.accdiv’).html(appndStr); } }, //complete:function(d){ // if(typparam1==1) // { // watchlist_popup(‘open’); // } //} }); }); } else { var disNam =’stock’; if($ (‘#impact_option’).html()==’STOCKS’) disNam =’stock’; if($ (‘#impact_option’).html()==’MUTUAL FUNDS’) disNam =’mutual fund’; if($ (‘#impact_option’).html()==’COMMODITIES’) disNam =’commodity’; alert(‘Please select at least one ‘+disNam); } } else { AFTERLOGINCALLBACK = ‘overlayPopup(‘+e+’, ‘+t+’, ‘+n+’)’; commonPopRHS(); /*work_div = 1; typparam = t; typparam1 = n; check_login_pop(1)*/ } } function pcSavePort(param,call_pg,dispId) { var adtxt=”; if(readCookie(‘nnmc’)){ if(call_pg == “2”) { pass_sec = 2; } else { pass_sec = 1; } var url = ‘//www.moneycontrol.com/mccode/common/saveWatchlist.php’; $ .ajax({url:url, type:”POST”, //data:{q_f:3,wSec:1,dispid:$ (‘input[name=sc_dispid_port]’).val()}, data:{q_f:3,wSec:pass_sec,dispid:dispId}, dataType:”json”, success:function(d) { //var accStr= ”; //$ .each(d.ac,function(i,v) //{ // accStr+=”+v.nm+”; //}); $ .each(d.data,function(i,v) { if(v.flg == ‘0’) { var modalContent = ‘Scheme added to your portfolio.’; var modalStatus = ‘success’; //if error, use ‘error’ $ (‘.mc-modal-content’).text(modalContent); $ (‘.mc-modal-wrap’).css(‘display’,’flex’); $ (‘.mc-modal’).addClass(modalStatus); //$ (‘#acc_sel_port’).html(accStr); //$ (‘#mcpcp_addportfolio .form_field, .form_btn’).removeClass(‘disabled’); //$ (‘#mcpcp_addportfolio .form_field input, .form_field select, .form_btn input’).attr(‘disabled’, false); // //if(call_pg == “2”) //{ // adtxt =’ Scheme added to your portfolio We recommend you add transactional details to evaluate your investment better. x‘; //} //else //{ // adtxt =’ Stock added to your portfolio We recommend you add transactional details to evaluate your investment better. x‘; //} //$ (‘#mcpcp_addprof_info’).css(‘background-color’,’#eeffc8′); //$ (‘#mcpcp_addprof_info’).html(adtxt); //$ (‘#mcpcp_addprof_info’).show(); glbbid=v.id; } }); } }); } else { AFTERLOGINCALLBACK = ‘pcSavePort(‘+param+’, ‘+call_pg+’, ‘+dispId+’)’; commonPopRHS(); /*work_div = 1; typparam = t; typparam1 = n; check_login_pop(1)*/ } } function commonPopRHS(e) { /*var t = ($ (window).height() – $ (“#” + e).height()) / 2 + $ (window).scrollTop(); var n = ($ (window).width() – $ (“#” + e).width()) / 2 + $ (window).scrollLeft(); $ (“#” + e).css({ position: “absolute”, top: t, left: n }); $ (“#lightbox_cb,#” + e).fadeIn(300); $ (“#lightbox_cb”).remove(); $ (“body”).append(”); $ (“#lightbox_cb”).css({ filter: “alpha(opacity=80)” }).fadeIn()*/ $ (“#myframe”).attr(‘src’,’https://accounts.moneycontrol.com/mclogin/?d=2′); $ (“#LoginModal”).modal(); } function overlay(n) { document.getElementById(‘back’).style.width = document.body.clientWidth + “px”; document.getElementById(‘back’).style.height = document.body.clientHeight +”px”; document.getElementById(‘back’).style.display = ‘block’; jQuery.fn.center = function () { this.css(“position”,”absolute”); var topPos = ($ (window).height() – this.height() ) / 2; this.css(“top”, -topPos).show().animate({‘top’:topPos},300); this.css(“left”, ( $ (window).width() – this.width() ) / 2); return this; } setTimeout(function(){$ (‘#backInner’+n).center()},100); } function closeoverlay(n){ document.getElementById(‘back’).style.display = ‘none’; document.getElementById(‘backInner’+n).style.display = ‘none’; } stk_str=”; stk.forEach(function (stkData,index){ if(index==0){ stk_str+=stkData.stockId.trim(); }else{ stk_str+=’,’+stkData.stockId.trim(); } }); $ .get(‘//www.moneycontrol.com/techmvc/mc_apis/stock_details/?sc_id=’+stk_str, function(data) { stk.forEach(function (stkData,index){ $ (‘#stock-name-‘+stkData.stockId.trim()+’-‘+article_id).text(data[stkData.stockId.trim()][‘nse’][‘shortname’]); }); });
Vishal Wagh, Research Head at Bonanza P0ortfolio
The benchmark equity indices on December 22 saw a gap-up opening tracking global peers and closed slightly above 1 percent thereby filling the gap created between 16,840 and 16,970.
The bounce got extended for the second consecutive trading session and the structure of the index appears to be in a consolidation range from 16,850 – 17,200. The lower high and lower low formation will be neglected only above 17,600 till then this can be considered as a relief rally.
Prices are trading below 21-week EMA (exponential moving average) which is placed at 17,134 acting as immediate resistance and above 50-Weekly EMA which is at 16,000.
On the daily Charts, momentum oscillator RSI (14) is still showing a reading below 50 and similarly ADX (Average Directional Index) which shows the strength of the trend has moved to 26 and rising with negative DMI (Directional Movement Index) moving up.
Nifty has reached a good hurdle zone of 16,950. If it manages to sustain above it, then some short-covering can’t be ruled out and 17,140 will be the next level for the index. The immediate support is coming near 16,850.
Here is one buy call and one sell call for next 2-3 weeks:
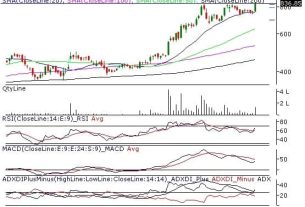
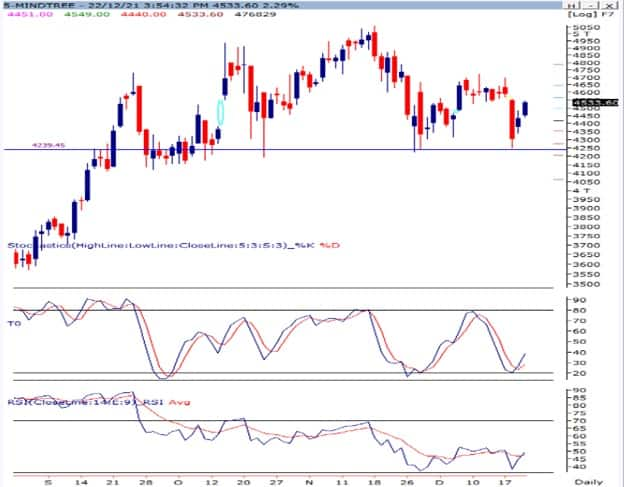
Mindtree: Buy | LTP: Rs 4,533.60 | Stop-Loss: Rs 4,240 | Target: Rs 4,940 | Return: 8.97 percent
The Mindtree has witnessed major support around the Rs 4,250 levels. It has created a ‘Harami’ candlestick pattern. Relative strength index (14,9) is currently reading around 50 and sustaining above the moving average. It has created a higher bottom near 38 levels.
On a relative basis, it is consistently outperforming the major indices. On the higher side, retesting of Rs 5,060 is possible. But on the move, there will be small resistance around Rs 4,930 levels.
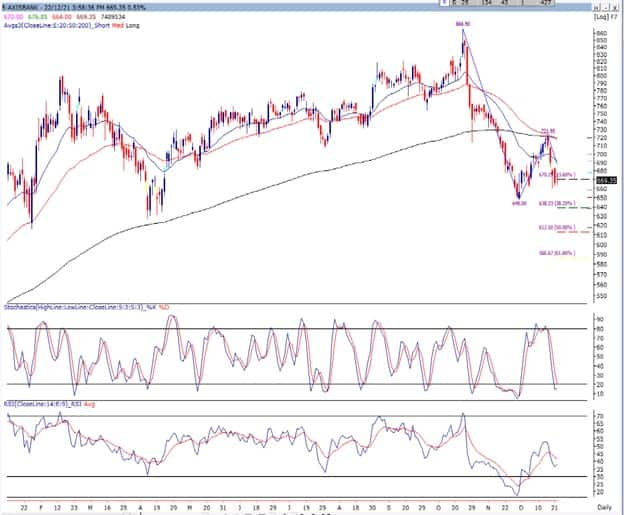
Axis Bank: Sell | LTP: Rs 669.35 | Stop-Loss: Rs 695 | Target: Rs 587 | Return: 12.25 percent
Axis Bank is consistently creating bearish lower low lower high chart formation. It is consistently below major EMA (200, 50 &20). In the chart, one can easily observe that it has taken resistance around 200 EMA and again sold off.
Relative strength index (14,9) is currently reading 50 and below the moving average. At the same time stochastic too, it is sustaining below the moving average. Both indicating towards further weakness in the stock.
Price extension from the top of October 25 is generating the target of Rs 586.
Disclaimer: The views and investment tips expressed by investment experts on Moneycontrol.com are their own and not those of the website or its management. Moneycontrol.com advises users to check with certified experts before taking any investment decisions.