(Illustration by Suneesh K.)
The prices of publicly-traded financial assets like equity shares and bonds etc., are materially influenced by the sentiments of fear and greed amongst the market participants, at least in the near term. The sentiment of greed drives the participants to bid higher prices for a security, even though the economic fundamentals underlying that security may not fully justify such price.
Similarly, the sentiment of fear prompts the market participants to offer the securities held by them at relatively cheaper rates. The equilibrium of sentiments of greed and fear keeps the markets stable and healthy, whereas dominance of either sentiment induces excessive volatility and irrational pricing in the markets. Extreme dominance of either sentiment usually marks the peak or bottom (as the case may be) of a market cycle.
If we examine the current equity market behaviour, it appears that the sentiment of fear is gradually becoming dominant amongst the market participants. The following five signs, for example, indicate that relatively weaker participants might be moving to sidelines or even withdrawing from the markets. This is usually indicative of the beginning of the process of a market cycle completing its downward journey. The actual bottoming though may take some time and further downward move.
Market activity shrinking
In the past six months, the market activity has cooled down conspicuously. The volumes in rupee terms as well as in terms of shares traded and number of trades executed have remained on the lower side, indicating shrinking participation in the market.
At peak of the market in October 2021, the average traded volume was over Rs 4,000 billion. However, in May 2022, it contracted to below Rs 2,800 billion. Similarly, the number of trades in October 2021 was over 130 billion, whereas in May 2022, only 108 billion trades were executed on NSE. In terms of number of shares traded, in October 2021, it was 83.58 billion shares on NSE. In May 2022, the number had contracted to 43.91 billion, almost half of October 2021.

Volatility persisting at higher levels
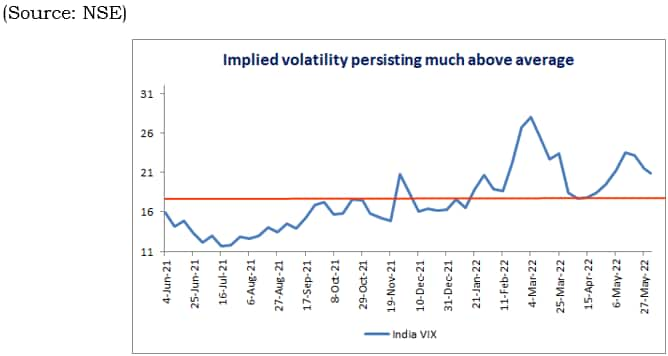
Since the benchmark Nifty recorded its all-time high level in October 2021, the implied volatility (popularly called the fear index) has persisted at higher levels; even though it has eased in the past 10 days.

Broader markets underperforming
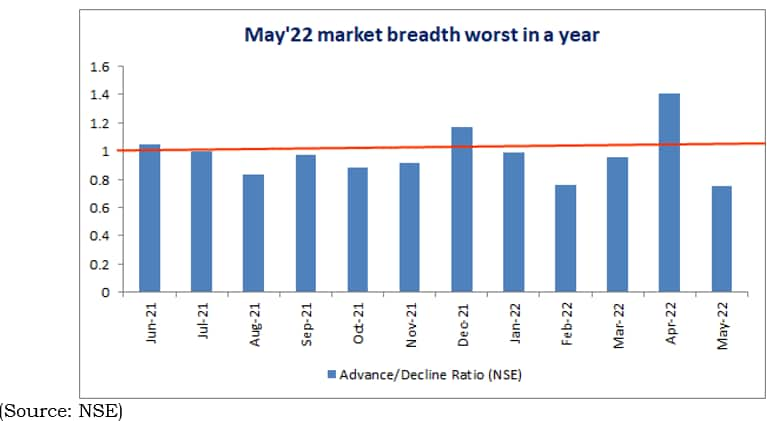
The market breadth has remained negative in eight out of the past twelve months. The market breadth on NSE was worst in at least the past twelve months. In fact, the market highs in October 2021 were recorded with a negative market breadth and high volumes; indicating a distribution pattern in the technical analysis parlance. Nifty50 has corrected ~10% from its latest closing highs, whereas Nifty Smallcap 100 index is down ~23% from its latest high levels; even though the smallcap high (January 2022) was recorded 3months later than Nifty (October 2021).
Sector-wise also, YTD 2022 only, Financials (1%), FMCG (1.5%), Auto (5%) and Energy (14%) sectors have yielded positive returns. IT Services (-22%), Realty (-15%), and Pharma (-12%) have been the worst performing sectors.

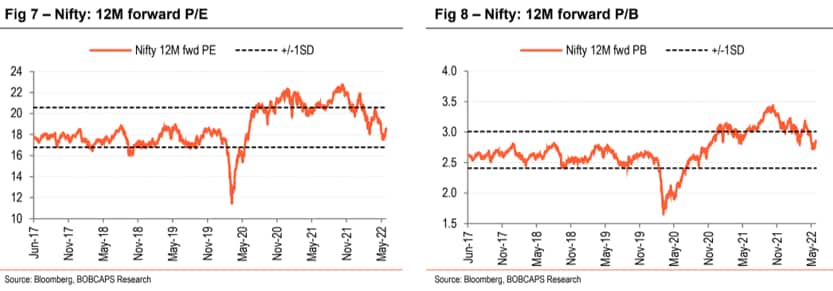
As the sentiment of fear has started to dominate the markets, the valuation excesses are now correcting. The 12month forward PE Ratio of the benchmark Nifty Index is now closer to 5yr average level. The price to book (P/B) ratio for Nifty has also corrected sharply from the higher levels seen in October 2021.
The valuations are now closer to “fair value” zone, a pre-condition for completion of the down leg of a market cycle (bottoming). It is however important to note that in many cases it has been seen that the earnings estimates are materially revised lower. In that case the “fair value” curve may shift sharply downward.

Global markets – sentiments most bearish since March 2020
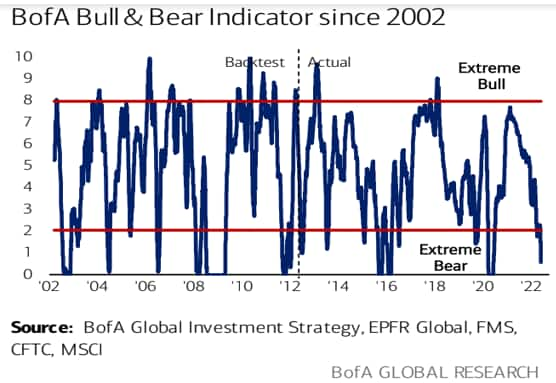
As per the Bank of America’s (BofA) proprietary Bulls and Bears Indicator, the global fund managers were most bearish in May 2022, since the Pandemic outbreak (March 2021).

