A little-known indicator with an impressive record — the gold-to-platinum ratio — is bullish for the U.S. stock market over the coming 12 months.
It’s important to point this out not just because bullish news is always welcome. It’s also a useful counterweight to investors’ growing pessimism. Inflation isn’t coming down as fast as previously thought, they complain. The U.S. Federal Reserve doesn’t appear eager to cut interest rates anytime soon. The risk of military escalation around the world seems higher than ever.
They’re right; there is plenty to worry about right now. But the news is not all bad.
Credit for discovering the gold-platinum ratio’s value as a market timing tool goes to Darien Huang, a former finance professor at Cornell University, and Mete Kilic, a finance professor at the University of Southern California. Their 2019 study in the Journal of Financial Economics, entitled “Gold, Platinum and Expected Stock Returns,” found that the stock market more often than not rises over the subsequent 12 months when the gold-platinum ratio is in a strong uptrend — and vice versa.
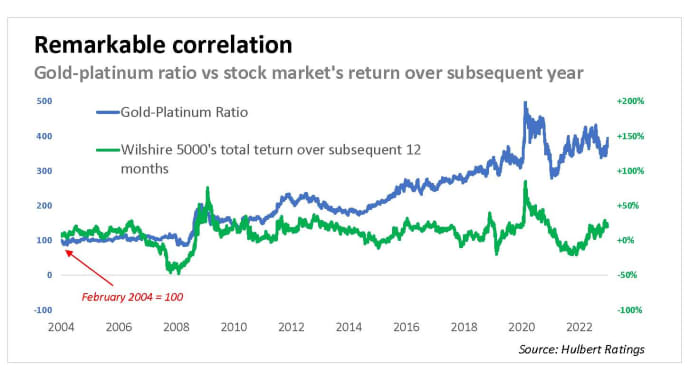
This tendency is illustrated in the accompanying chart encompassing the past 20 years. The blue line represents the ratio of gold’s GC00, -0.83% cumulative return since February 2004 to platinum’s PL00, -2.08% over the same period. What’s important is not the absolute value of the ratio but its trend.
The green line represents the stock market’s total return over the subsequent 12 months. The correlation between the two series is impressive. Huang and Kilic report that, in their testing, the gold platinum ratio had one of the best track records of any indicator that they studied — outperforming “nearly all existing return predictors.”
“The current gold-platinum ratio is in the second-highest quartile of trailing-year change. ”
The table below quantifies this tendency, based on the past 20 years.
| When gold-platinum ratio’s 12-month return was in… | Average subsequent 12-month return of Wilshire 5000 Total Return Index |
| The lowest 25% of readings since 2004 | 6.5% |
| The 2nd-lowest quartile | 6.0% |
| The 2nd-highest quartile | 15.2% |
| The highest 25% of readings since 2004 | 20.5% |
This is good news, since the current gold-platinum ratio is in the second-highest quartile of trailing-year change, represented by the second row from the bottom in the table. That quartile gained 15.2% on average over a 12-month period.
Timing is everything
The gold-platinum ratio works as a market timing indicator, according to the study’s authors, because it is a highly sensitive measure of perceived economic and geopolitical risk, and investors demand a higher expected stock market return when risk is higher.
And the reason the gold-platinum ratio is a superior measure of risk is because the two metals respond to different factors: Both tend to rise and fall in line with industrial demand, but gold is far more sensitive than platinum to investors’ perception of economic and geopolitical risk.
This explanation will strike many of you as counterintuitive. Investors can demand a higher return all they want, you might say, but that doesn’t mean the stock market will accommodate them. But the researchers’ explanation makes sense: Investors sell stocks when risk rises, in the process reducing the market’s current performance and boosting future returns. Huang and Kilic write that the gold-platinum ratio “is high when stock prices are low and the equity risk premium is high, giving [the ratio] the power to predict future stock returns.”
Mark Hulbert is a regular contributor to MarketWatch. His Hulbert Ratings tracks investment newsletters that pay a flat fee to be audited. He can be reached at mark@hulbertratings.com
More: Why gold prices are likely to reach a record high in 2024
Plus: Bundle up: February often puts investors on ice as stocks go cold