“The Dow’s average February return after rising in January is just 0.16%.”
Wall Street’s excitement over the bullish posture of the January Indicator tells us more about their exuberance than how the U.S. stock market will actually perform this year.
There’s a belief on Wall Street that “as goes January, so goes the year.” After a rocky start to the month, which initially suggested that the January Indicator might be negative for the rest of 2024, the U.S. stock market has rebounded nicely — making it almost certain that January will be a positive month for the market and the January Indicator will be bullish for the year.
If only the January Indicator rested on a strong statistical foundation.
I’ve questioned the January Indicator before, and in this column, I’m looking at it in a new way. For each month since 1896, I calculated the Dow Jones Industrial Average’s DJIA success rate at predicting the stock market’s direction over the subsequent 11 months. As you can see from the accompanying chart, several months are almost as good an indicator as January — such as July and December. And the success rate for another month — November — is just as good as December.
So there is nothing particularly unique about January.
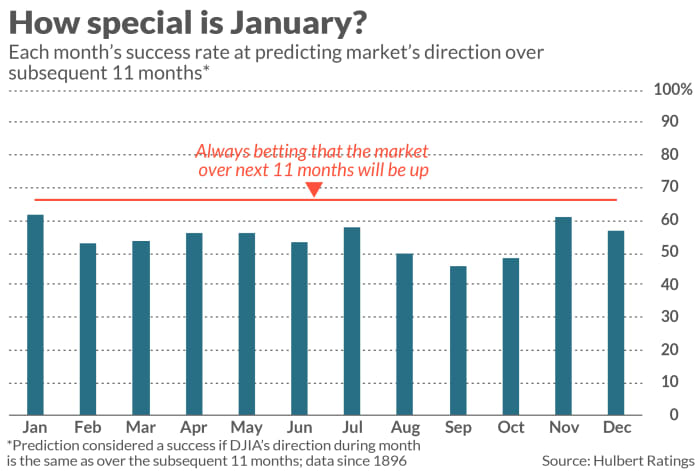
You might conclude from these results that there should be a November, July or December Indicator in addition to January. However, the data do not support that conclusion. The reason many different months have what appears to be decent predictive abilities is that the stock market rises far more often than not. So it only looks like the stock market’s direction in a given month “predicts” the market’s subsequent-11-months direction. To claim that it does makes no more sense than concluding that, because night follows day, day “causes” night.
Another implication of the chart is that, because the market rises more often than not, you would do better than the January Indicator by always predicting that the market would be up over the subsequent 11 months. Since 1896, such a prediction would have been successful 66.2% of the time. This is represented by the red line in the chart, and you’ll notice that this is better than the success rate of not just January but those of all the other months as well.
Another reason to question the statistical foundation of the January Indicator is that the market in February typically reverses its January direction. This is not what you would expect if there were a strong basis in reality for the January Indicator, as opposed to being little more than an artifact of investor sentiment.
Consider that the Dow’s average February return after rising in January is just 0.16%, which is below the average gain across all months since 1896 of 0.62%. The most likely cause of this below-average performance is that exuberant traders jump on the bullish bandwagon at the end of those Januarys in which it becomes clear that the market will be up for the month. This causes the market to get ahead of itself, leading to below-average performance in February.
Mark Hulbert is a regular contributor to MarketWatch. His Hulbert Ratings tracks investment newsletters that pay a flat fee to be audited. He can be reached at mark@hulbertratings.com
More: 1987 stock-market crash has lessons for traders convinced Fed will slash rates in 2024
Also read: BlackRock cites AI in upgrading U.S. stocks to overweight