A telltale recession signal on Wall Street hasn’t been this jumpy since the Volcker era some 40 years ago.
Paul Volcker, chairman of the Federal Reserve from 1979 to 1987, relied on interest-rate hikes four decades ago to tame high inflation, a similar challenge faced by today’s Fed Chair Jerome Powell.
The U.S. government in both periods was paying investors far more to borrow for 2-years than for 10 years, highlighted in recent months by 5% yields in shorter-dated Treasury securities.
See: ‘T-bill and chill’ trade sees big influx from individual investors
The mismatch in yields produces what Wall Street calls an “inverted yield curve” (see chart) in the Treasury market, a strong past signal that a U.S. recession probably lurks on the horizon, albeit often with a long lag.
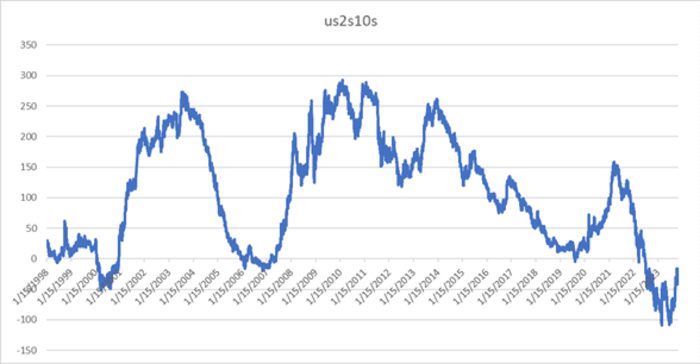
Bond traders haven’t been this jumpy since Paul Volcker’s Federal Reserve.
Tradeweb
While inverted yield curves can be a poor timing signal for the stock market, this stretch of inversion has been extremely volatile for bonds, with the roughly $ 26 trillion Treasury market acting as a rudder.
The S&P 500 SPX and Nasdaq Composite Index COMP fell into correction territory in October as longer-duration bond yields made a run for the 5% mark, before easing back in November. All three equity benchmarks booked back-to-back weekly gains Friday.
That notched yet another zigzag in what has been a gut-wrenching path for the 2-year BX:TMUBMUSD02Y and 10-year BX:TMUBMUSD10Y Treasury yield curve, the most extreme since Volcker’s stint at the helm of the Fed, according to Fed data.
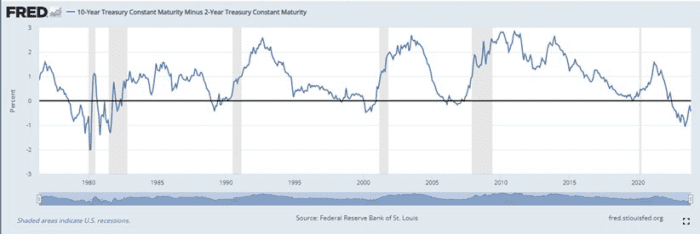
The gap between 2-year and 10-year Treasury yields hasn’t been this volatile since the 1980s.
Federal Reserve Bank of St. Louis
Peter Corey, co-founder and chief market strategist at Pave Finance, said that’s because the yield curve lately represents fixed-income traders “as greyhounds racing behind a mechanical rabbit, but that rabbit has been slammed into reverse more than a few times.”
In his scenario, the “rabbit” represent recent comments from the Federal Reserve about rates, inflation and the economy, especially since July when its policy rate hit a 22-year high, in the 5.25% to 5.5% range.
The Fed since July has been on pause, holding rates steady, as it watches economic and inflation data play out, while also keeping traders on their toes for any clues as to its next moves.
Thierry Wizman, a global rates strategist at Macquarie, said on Friday that a U.S. inflation update Tuesday via the consumer-price index for October will be another milestone for the market.
“It’s likely to have a calming effect on markets, as traders weigh the prospect that a very low headline CPI result will further cool the prospect of excessive wage demands in the labor market.”
Consumer prices for September came in hotter than forecast at a 3.7% yearly rate. Powell on Thursday said higher interest rates might be needed to bring inflation sustainably down to the central bank’s 2% annual target, a similar message from his early November press conference.
See: Powell says Fed is wary of ‘head fakes’ from inflation
However, the Fed also has been monitoring higher long-term Treasury yields, even signaling they have been doing some of the Fed’s work for it, in terms of taming inflation. Powell said Thursday the central bank wasn’t currently basis policy decisions on higher long-term yields.
The 10-year Treasury yield was at 4.627% on Friday, down from 5% in October, but above a 3.3% recent low in April. The 2-year yield was at 5.06% Friday, according to FactSet data. The curve has been inverted since last year.
A more typical path for 2-year and 10-year yields after a sustained inversion has been a “steepening,” or renormalization, of the curve, said Corey at Pave, noting it represents traders anticipating an economic slowdown, and Fed rate cuts.