In my day, applying to college meant thumbing through a big paperback encyclopedia of college listings and then pulling out the typewriter and filling in applications. Thirty-some years later as my kid prepares to apply, I need a spreadsheet and access to reams of data that I’m not sure how to process.
I’ve tried doing it the old-fashioned way, by searching through the websites of all the schools my high-school senior is interested in applying to. For each school, you need to find the common data set, a multipage PDF that lists seemingly unrelated stats. Then you need to run the net-price calculator, which attempts to give you a price tag based on the financial information you input. Then you put everything together to try to get some sense of your kid’s chances of getting in and what it might cost you so you can compare the schools to each other.
Of course, there’s an app for that. Well, not so much one app, but several different programs that purport to sort college data in a useful way — some of them free, some by subscription and some through the school. All of it is still confusing and overwhelming for the average family.
Big J Education Consulting is attempting to make it easier with interactive charts, available on its website for free, that allow you to easily sort through data from the common data sets of hundreds of schools, plus some of the company’s own fact-checked and reported updates. Co-owners Jennie Kent and Jeff Levy have been making these charts for years for their own business, and they went high-tech with a new format this year that makes sorting and crunching the data easy enough for a layperson to do.
“People think about that common data set as a snapshot, but it’s really more of a collage,” says Kent. “Admissions fills out part, financial aid fills out part. Sometimes numbers are off, and we reach out to institutions. The best that any of us can do with this is to use the common data set.”
Take, for instance, the sometimes outrageous cost-of-attendance number, a sticker price that includes tuition, room and board, books and fees for one year. At the top of their list is Northwestern University in Evanston, Ill., at a whopping $ 89,394. Levy and Kent say they are hearing from a number of schools that the price for the upcoming year will be over $ 90,000, at least for international students.
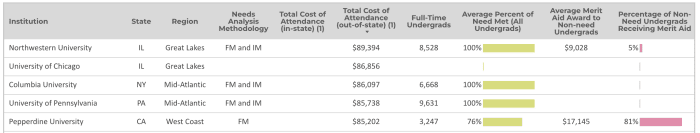
Need-based and merit aid for the class of 2026, sorted by total cost of attendance for out-of-state students.
Credit: Jennie Kent, Jeff Levy, and Big J Educational Consulting, 2023
You can learn a lot from looking at a chart like this and playing with it according to the choices pertinent to your family. For instance, one thing to note is that if you sort by price, you don’t see prices below $ 80,000 until you get four pages in. Those are the most expensive 78 out of 427 schools.
To get to the least expensive schools, you have to sort by in-state prices, because most of these will be public institutions that offer special pricing to state residents.

Need-based and merit aid for the class of 2026, sorted by total cost of attendance for in-state students.
Credit: Jennie Kent, Jeff Levy, and Big J Educational Consulting, 2023
Of course, a school’s list price does not tell you how much it will cost your family to send a student there. The price you pay will depend on your own family’s financial situation, and that’s where all the strategizing comes in — and why families sometimes turn to professionals to crunch this data for them.
To get any kind of handle on that, you have to look at the other columns detailed on the chart below that analyze how much need-based aid a school gives and how much it gives out in so-called merit aid, which college finance experts have taken to calling “tuition discounting,” because it really just represents a coupon value off the sticker price.
If your family falls under the threshold of “need,” which varies by school, you can get a decent picture of what your price may be from the net-price calculator. But if you fall outside of those parameters, you’ll want to know how generous a school is with that tuition discounting. You really have to look at two numbers to figure this out, because the average amount of merit aid can be inflated by the small number of students it goes to.
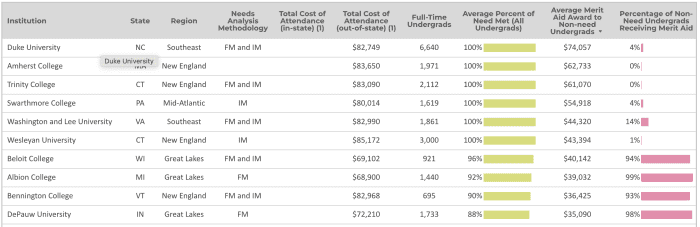
Need-based and merit aid for the class of 2026, average merit aid awarded to non-need undergrads.
Credit: Jennie Kent, Jeff Levy, and Big J Educational Consulting, 2023
For instance, according to common-data-set data compiled by Big J, Duke meets all needs of undergraduates and gives out an average of $ 74,057 in merit awards to non-need undergrads, but it only gives that out to 4% of its full-pay applicants. Whereas Beloit College meets 96% of need but gives out an average of $ 40,142 in merit awards to 94% of non-need undergrads. Which sounds like the better chance of getting a discount?
You can input your own selection of colleges into this list and do a comparison that way. I input the top colleges on my child’s list and was able to see how they stacked up against each other in terms of merit aid and tuition price. I found that useful for weeding some out.
Playing the early game
None of the price modeling matters if your child doesn’t get into a school in the first place. That’s where strategizing over what type of application to submit matters. A little data visualization on early admission might help you if you want to play that game. And if you pair it with the financial data, you can get a sense of whether it matters at a particular school to apply early, and what it might cost you — since the decision is supposed to be binding.
The choice of whether to apply for early decision is complicated this year because the federal financial-aid form, FAFSA, is not opening until December, and schools cannot typically finalize their aid packages without it. Plus, more colleges across the spectrum are filling their classes with early admits because it maximizes their yield statistics — that is, the number of students who accept their offers. So competition is fierce.
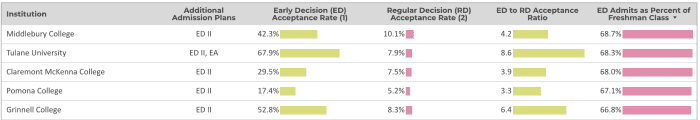
Early-decision and regular-decision acceptance rates for the class of 2026, sorted by early admits as percent of freshman class.
Credit: Jennie Kent, Jeff Levy, and Big J Educational Consulting, 2023
On the Big J chart for early-decision and regular-decision acceptance rates, the schools making the most of this are filling more two-thirds of their classes with early admits. They are also typically accepting students at a far greater rate from the early-decision pool than they are from the regular-decision pool. At Tulane, for instance, the early-decision acceptance rate is 8.6 times greater than that for regular decisions.
Looking at that data might make you feel a little pressure, but remember, at the end of the day, the only school your child should pick for early decision is one that you can afford and that is a good fit for them.