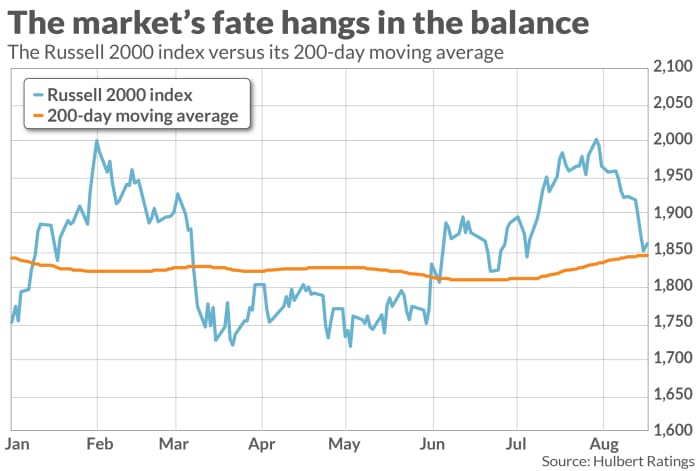
Stock market bulls need not be concerned that the Russell 2000 index RUT is on the brink of dropping below its 200-day moving average.
This sanguine assessment may surprise you, since for decades technicians have considered breaking below the 200-day moving average to be a major bear market signal. In fact, though, the moving average never enjoyed much historical support, and what little support it did have disappeared completely starting about 30 years ago.
Unlike the Russell 2000, which is a proxy for the small- and midcap sectors, large-cap dominated market averages such as the S&P 500 SPX remain several percentage points above their 200-day moving averages. But the Russell 2000 is considered by many to be a canary in the coal mine, revealing the true health of the market that may be masked by a few large-caps. In intraday trading Monday, the Russell 2000 index declined to sit almost exactly on top of its 200-day moving average—as you can see from the accompanying chart.

To test the predictive powers of the 200-day moving average, I analyzed data back to 1928, nearly a century ago. Buy signals were registered on days when the S&P 500 closed above its 200-day moving average after having been below the prior day. Sell signals were the mirror opposite. At the 95% confidence level that statisticians often use when assessing whether a pattern is genuine, sell signals were not followed by below-average returns over the subsequent month, quarter, six-month period, or year. Buy signals were not followed by above-average returns.
That’s bad enough, but the 200-day moving average’s track record became even worse in the early 1990s. Blake LeBaron, an economics professor at Brandeis University who has extensively researched technical indicators, thinks that a likely culprit is that, around that time, ETFs were created that made it possible for investors to trade into and out of the market at any time of the trading session at negligible cost. Prior to the early 1990s, in contrast, it would have been very difficult to quickly and cheaply act on signals generated by the 200-day moving average.
Regardless of the cause(s), the 200-day moving average’s record over the last three decades has been particularly disappointing, as you can see from the table below. Notice that, following 200-day moving average sell signals, the stock market performed better over the subsequent month, quarter and six-month periods than following buy signals.
| Subsequent month | Subsequent 3 months | Subsequent 6 months | Subsequent 12 months | |
| 200-day moving average buy signals since 1993 | 0.8% | 3.2% | 5.2% | 8.1% |
| 200-day moving average sell signals since 1993 | 1.3% | 3.4% | 5.5% | 7.9% |
| All days since 1993 | 0.7% | 2.2% | 4.4% | 9.1% |
The bottom line? If you want to worry about something, there is no shortage of causes for concern. The possibility the market will drop below its 200-day moving average is not an additional reason to be worried.
Mark Hulbert is a regular contributor to MarketWatch. His Hulbert Ratings tracks investment newsletters that pay a flat fee to be audited. He can be reached at mark@hulbertratings.com.
