The selloff in Apple Inc.’s stock Friday was enough for chart watchers to refer to it as a breakdown, as it confirmed the break of a trendline that has defined the stock’s rally since the start of the year.
One of the most recognized and agreed-with trading axioms on Wall Street is, “The trend is your friend.” An addendum to that axiom is only slightly less well known: The trend is your friend, “until it’s not.”
The easiest, if not the best way, to identify a trend is by drawing a trendline. Keep in mind that while two points can make a line, it takes a third point to confirm a trendline. And the more points on that line, the more valid the trend, and the more clear the breakdown.
For Apple’s stock chart AAPL, -4.34%, there is a pretty well-defined uptrend line that starts at the stock’s 19-month intraday low hit on Jan. 3 and roughly connects with a number of lows along the way.
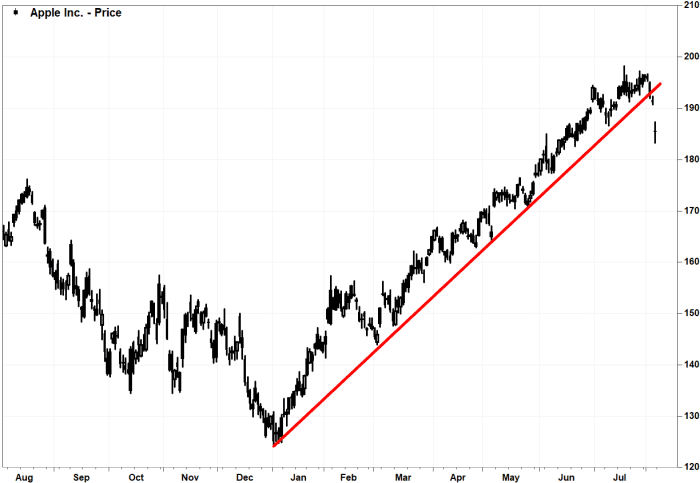
FactSet, MarketWatch
The technology behemoth’s stock slipped below that line earlier this week, ahead of Apple’s fiscal third-quarter earnings report out late Thursday. But it wasn’t quite enough to confirm the break of such a defined trend.
One of the six tenets of the century-old Dow Theory of market analysis is that a trend is assumed to be in effect until it gives a definite signal that it has reversed.
Also read: Don’t diss the Dow Theory just because it’s over 100 years old.
With Apple’s stock down 3.6% in afternoon trading Friday after the report was released, the breakdown looks pretty definite.
Don’t miss: Apple’s slowdown era rages on, and the iPhone may not be enough to power its stock.
With that breakdown, Fairlead Strategies LLC technical analyst Katie Stockton said she is watching how the stock trades around the 50-day moving average, to see if that short-term trend tracker can provide support.
The stock is currently trading slightly below the 50-DMA, which extends to just about $ 187 on Friday.
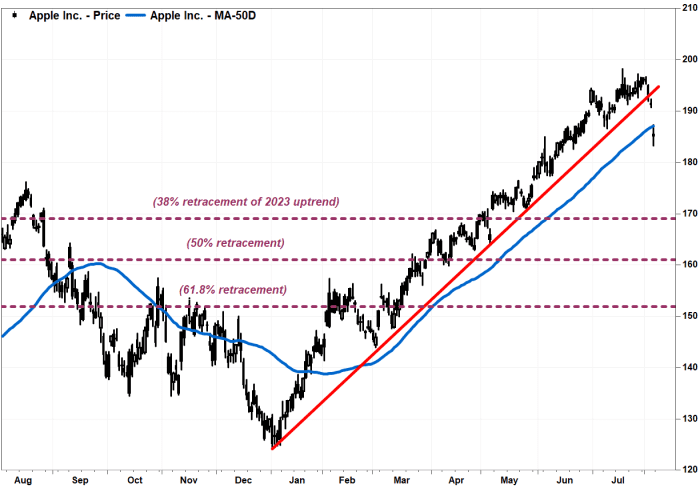
FactSet, MarketWatch
For Wall Street followers of the mathematical Fibonacci ratio of 1.618, also known as the “golden” or “divine” ratio given its prevalence in natural systems, the next downside level to watch would be around $ 169. That marks the 38.2% retracement (1 minus 0.618) of the rally off the Jan. 5 closing low of $ 125.02 to the July 31 record close of $ 196.45.
Read more about Wall Street’s use of the Fibonacci ratio.
Below that, the other key Fibonacci levels to watch would be about $ 161, or a 50% retracement, and at roughly $ 152, or a 61.8% retracement.
Many on Wall Street believe if a retracement stays within 61.8% of the prior trend, that prior trend still has life.
Apple’s stock has rallied 41.9% since the start of the year, while the technology-heavy Nasdaq-100 Index NDX has climbed 40.9% and the Dow Jones Industrial Average DJIA has tacked on 6.5%.