Six months have passed since the S&P 500 index touched its lowest level in more than two years after shedding about 25% of its value at the nadir of 2022’s bear market.
A recovery since the start of 2023 has seen the large capitalization index rise more than 17% from its Oct. 12 closing low of 3,577.03, according to FactSet data.
However, investors still have plenty of reason to fear that the worst has yet to arrive, if history is any guide, according to Warren Pies, the founder of research shop 3Fourteen Research.
Pies and his team highlighted four reasons in a recent note to clients that was shared with MarketWatch.
“The last six months hold very little resemblance to a typical post-bottom environment,” he said in a note.
The S&P 500 SPX, +0.36% was trading marginally lower early Wednesday, but it has risen 6.8% since the start of the year, and 17.1% from its intraday low reached on Oct. 13, 2022, according to FactSet data. The lowest closing level arrived one day earlier, when the large-cap index finished at 3,577, its lowest end-of-day level since November 2020.
Earnings expectations continue to fall
Earnings expectations for S&P 500 companies are a key metric for investors, since they are used to calculate the market’s forward price-to-earnings ratio, which is one of the most popular valuation metrics used by investment analysts.
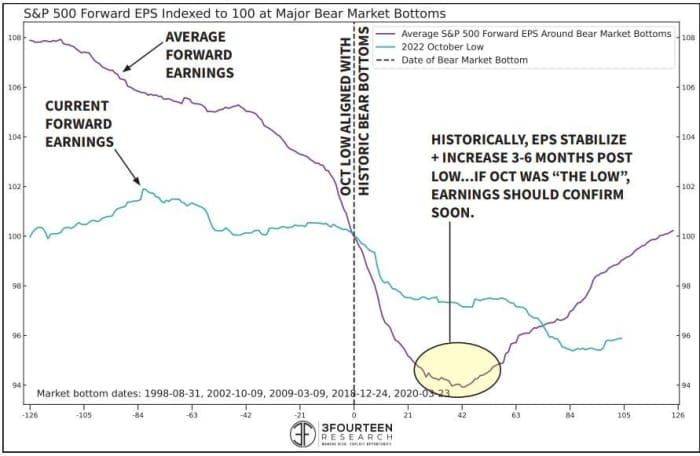
Typically, forward earnings estimates start to recover between three and six months after a durable market bottom, according to Pies and his team.
But according to consensus estimates tracked by FactSet, expectations for earnings in 2023 have continued to sour following the collapse of Silicon Valley Bank.
“The crisis, and resultant tightening of financial conditions, is likely to weigh on forward earnings (no rebound). Unsurprisingly, Financial Sector estimates are already rolling over hard,” Pies and his team said in the report.
They illustrated this trend in the chart below.
3FOURTEEN RESEARCH
The bottom-up EPS estimate for calendar-year 2023 declined by 3.8% — to $ 221.50 from $ 230.33 — between Dec. 31 to March 30, according to FactSet’s John Butters.
The forward 12-month P/E ratio for the S&P 500 stands at 18.15 as of Wednesday, according to FactSet data. That’s below the five-year average of 18.5 but it remains above the 10-year average of 17.3.
S&P 500 doesn’t bottom while interest rates are rising
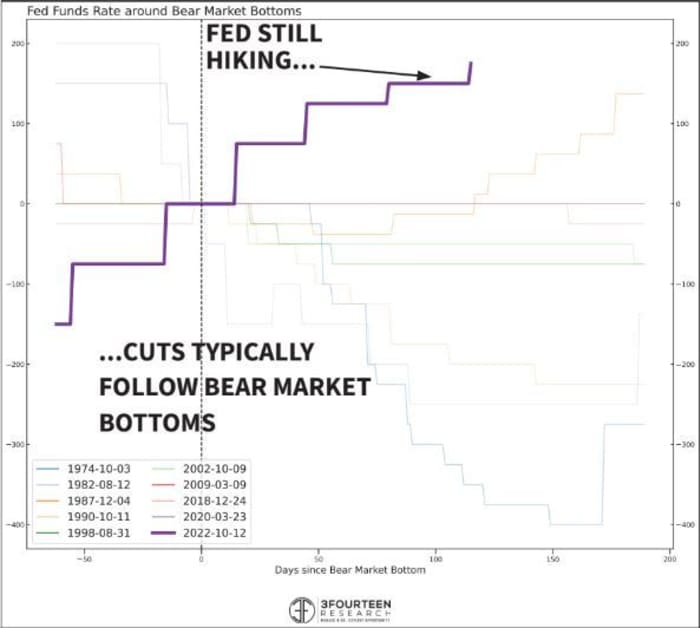
It’s a refrain that has been repeated by many stock-market analysts. Historically, the S&P 500 doesn’t bottom until after the Federal Reserve starts to cut interest rates.
“Stocks have never bottomed during the hike phase of a Fed Cycle,” Pies and his team said.
This was certainly true in March 2020, at the start of the pandemic when stocks bottomed a few days after the Fed cut its policy interest rate to zero and announced steps to improve corporations’ access to credit.
3FOURTEEN
Credit spreads a concern
U.S. stocks have powered higher this year, but investment-grade credit spreads are not looking so healthy.
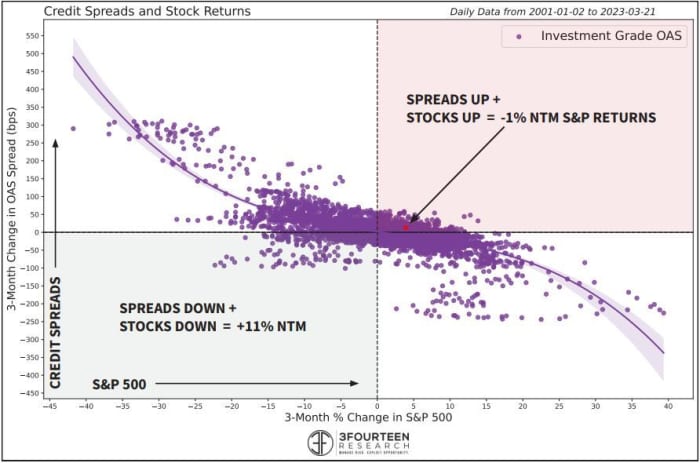
“While equities continue to bounce up towards the top of their trading range (S&P 500 ~4,000), investment grade credit spreads have blown out to 163 bps, which is just under the October highs (165)—back when the stock market was making its low (chart right). This is an awful combination for forward equity returns,” he said.
3Fourteen added that “typically, IG spreads and stocks move together. However, when spreads blow out while stocks are up (top right quadrant), stocks suffer badly in the next 12 months,” they said.
3FOURTEEN
Treasury yield curve still inverted
The yield on the 2-year Treasury note TMUBMUSD02Y, 3.965% was roughly 40 basis points higher than that of the 10-year note TMUBMUSD10Y, 3.404% as of Wednesday, according to FactSet data. That’s a substantial improvement from roughly one month ago, when the curve inverted by roughly 100 basis points, its most inverted level in decades.
It’s still a long way away from normal though, where investors typically can expect to be paid a premium for holding longer-dated bonds.
Historically, the yield curve has returned to some semblance of normal six months after a market bottom, but that hasn’t happened yet.
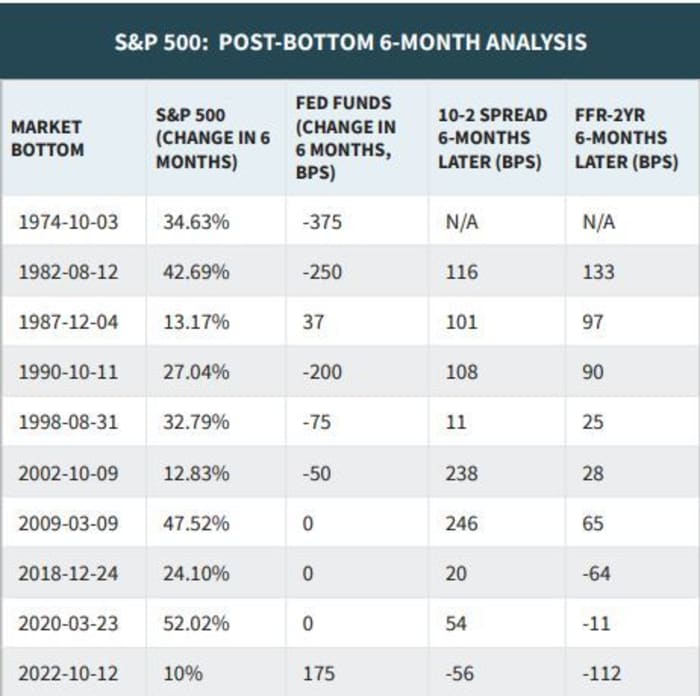
3FOURTEEN
U.S. stocks have been vacillating in a tight range all year. The difference between the S&P 500’s 2023 high and its 2023 low is less than 400 points.
For what it’s worth, Wall Street strategists are growing increasingly pessimistic about stocks, including JPMorgan Chase & Co. equity strategist Marko Kolanovic.
All three major U.S. indexes were trading in the red early Wednesday, with the S&P 500 down 0.6%, while the Nasdaq Composite COMP, +0.76% was off by 1.4%, and the Dow Jones Industrial Average DJIA, +0.01% was marginally lower, helped by its larger weighting toward “defensive” value stocks.