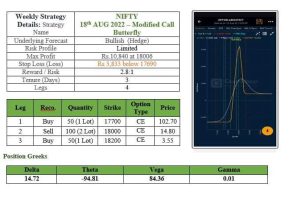
On the Options front, we have maximum Call Open interest at 19,000 strike, which is Out-Of-Money (OTM) indicating the traders are betting big on 19,000 mark again. Whereas on the Put side, the maximum open interest was at 18,000 strike, suggesting crucial support area for the Nifty in January series
Sunil Shankar Matkar
January 02, 2023 / 08:36 AM IST
")
(Illustration by Suneesh K.)
‘); $ (‘#lastUpdated_’+articleId).text(resData[stkKey][‘lastupdate’]); //if(resData[stkKey][‘percentchange’] > 0){ // $ (‘#greentxt_’+articleId).removeClass(“redtxt”).addClass(“greentxt”); // $ (‘.arw_red’).removeClass(“arw_red”).addClass(“arw_green”); //}else if(resData[stkKey][‘percentchange’] < 0){ // $ (‘#greentxt_’+articleId).removeClass(“greentxt”).addClass(“redtxt”); // $ (‘.arw_green’).removeClass(“arw_green”).addClass(“arw_red”); //} if(resData[stkKey][‘percentchange’] >= 0){ $ (‘#greentxt_’+articleId).removeClass(“redtxt”).addClass(“greentxt”); //$ (‘.arw_red’).removeClass(“arw_red”).addClass(“arw_green”); $ (‘#gainlosstxt_’+articleId).find(“.arw_red”).removeClass(“arw_red”).addClass(“arw_green”); }else if(resData[stkKey][‘percentchange’] < 0){ $ (‘#greentxt_’+articleId).removeClass(“greentxt”).addClass(“redtxt”); //$ (‘.arw_green’).removeClass(“arw_green”).addClass(“arw_red”); $ (‘#gainlosstxt_’+articleId).find(‘.arw_green’).removeClass(“arw_green”).addClass(“arw_red”); } $ (‘#volumetxt_’+articleId).show(); $ (‘#vlmtxt_’+articleId).show(); $ (‘#stkvol_’+articleId).text(resData[stkKey][‘volume’]); $ (‘#td-low_’+articleId).text(resData[stkKey][‘daylow’]); $ (‘#td-high_’+articleId).text(resData[stkKey][‘dayhigh’]); $ (‘#rightcol_’+articleId).show(); }else{ $ (‘#volumetxt_’+articleId).hide(); $ (‘#vlmtxt_’+articleId).hide(); $ (‘#stkvol_’+articleId).text(”); $ (‘#td-low_’+articleId).text(”); $ (‘#td-high_’+articleId).text(”); $ (‘#rightcol_’+articleId).hide(); } $ (‘#stk-graph_’+articleId).attr(‘src’,’//appfeeds.moneycontrol.com/jsonapi/stocks/graph&format=json&watch_app=true&range=1d&type=area&ex=’+stockType+’&sc_id=’+stockId+’&width=157&height=100&source=web’); } } } }); } $ (‘.bseliveselectbox’).click(function(){ $ (‘.bselivelist’).show(); }); function bindClicksForDropdown(articleId){ $ (‘ul#stockwidgettabs_’+articleId+’ li’).click(function(){ stkId = jQuery.trim($ (this).find(‘a’).attr(‘stkid’)); $ (‘ul#stockwidgettabs_’+articleId+’ li’).find(‘a’).removeClass(‘active’); $ (this).find(‘a’).addClass(‘active’); stockWidget(‘N’,stkId,articleId); }); $ (‘#stk-b-‘+articleId).click(function(){ stkId = jQuery.trim($ (this).attr(‘stkId’)); stockWidget(‘B’,stkId,articleId); $ (‘.bselivelist’).hide(); }); $ (‘#stk-n-‘+articleId).click(function(){ stkId = jQuery.trim($ (this).attr(‘stkId’)); stockWidget(‘N’,stkId,articleId); $ (‘.bselivelist’).hide(); }); } $ (“.bselivelist”).focusout(function(){ $ (“.bselivelist”).hide(); //hide the results }); function bindMenuClicks(articleId){ $ (‘#watchlist-‘+articleId).click(function(){ var stkId = $ (this).attr(‘stkId’); overlayPopupWatchlist(0,2,1,stkId); }); $ (‘#portfolio-‘+articleId).click(function(){ var dispId = $ (this).attr(‘dispId’); pcSavePort(0,1,dispId); }); } $ (‘.mc-modal-close’).on(‘click’,function(){ $ (‘.mc-modal-wrap’).css(‘display’,’none’); $ (‘.mc-modal’).removeClass(‘success’); $ (‘.mc-modal’).removeClass(‘error’); }); function overlayPopupWatchlist(e, t, n,stkId) { $ (‘.srch_bx’).css(‘z-index’,’999′); typparam1 = n; if(readCookie(‘nnmc’)) { var lastRsrs =new Array(); lastRsrs[e]= stkId; if(lastRsrs.length > 0) { var resStr=”; let secglbVar = 1; var url = ‘//www.moneycontrol.com/mccode/common/saveWatchlist.php’; $ .get( “//www.moneycontrol.com/mccode/common/rhsdata.html”, function( data ) { $ (‘#backInner1_rhsPop’).html(data); $ .ajax({url:url, type:”POST”, dataType:”json”, data:{q_f:typparam1,wSec:secglbVar,wArray:lastRsrs}, success:function(d) { if(typparam1==’1′) // rhs { var appndStr=”; //var newappndStr = makeMiddleRDivNew(d); //appndStr = newappndStr[0]; var titStr=”;var editw=”; var typevar=”; var pparr= new Array(‘Monitoring your investments regularly is important.’,’Add your transaction details to monitor your stock`s performance.’,’You can also track your Transaction History and Capital Gains.’); var phead =’Why add to Portfolio?’; if(secglbVar ==1) { var stkdtxt=’this stock’; var fltxt=’ it ‘; typevar =’Stock ‘; if(lastRsrs.length>1){ stkdtxt=’these stocks’; typevar =’Stocks ‘;fltxt=’ them ‘; } } //var popretStr =lvPOPRHS(phead,pparr); //$ (‘#poprhsAdd’).html(popretStr); //$ (‘.btmbgnwr’).show(); var tickTxt =’‘; if(typparam1==1) { var modalContent = ‘Watchlist has been updated successfully.’; var modalStatus = ‘success’; //if error, use ‘error’ $ (‘.mc-modal-content’).text(modalContent); $ (‘.mc-modal-wrap’).css(‘display’,’flex’); $ (‘.mc-modal’).addClass(modalStatus); //var existsFlag=$ .inArray(‘added’,newappndStr[1]); //$ (‘#toptitleTXT’).html(tickTxt+typevar+’ to your watchlist’); //if(existsFlag == -1) //{ // if(lastRsrs.length > 1) // $ (‘#toptitleTXT’).html(tickTxt+typevar+’already exist in your watchlist’); // else // $ (‘#toptitleTXT’).html(tickTxt+typevar+’already exists in your watchlist’); // //} } //$ (‘.accdiv’).html(”); //$ (‘.accdiv’).html(appndStr); } }, //complete:function(d){ // if(typparam1==1) // { // watchlist_popup(‘open’); // } //} }); }); } else { var disNam =’stock’; if($ (‘#impact_option’).html()==’STOCKS’) disNam =’stock’; if($ (‘#impact_option’).html()==’MUTUAL FUNDS’) disNam =’mutual fund’; if($ (‘#impact_option’).html()==’COMMODITIES’) disNam =’commodity’; alert(‘Please select at least one ‘+disNam); } } else { AFTERLOGINCALLBACK = ‘overlayPopup(‘+e+’, ‘+t+’, ‘+n+’)’; commonPopRHS(); /*work_div = 1; typparam = t; typparam1 = n; check_login_pop(1)*/ } } function pcSavePort(param,call_pg,dispId) { var adtxt=”; if(readCookie(‘nnmc’)){ if(call_pg == “2”) { pass_sec = 2; } else { pass_sec = 1; } var postfolio_url = ‘https://www.moneycontrol.com/portfolio_new/add_stocks_multi.php?id=’+dispId; window.open(postfolio_url, ‘_blank’); } else { AFTERLOGINCALLBACK = ‘pcSavePort(‘+param+’, ‘+call_pg+’, ‘+dispId+’)’; commonPopRHS(); /*work_div = 1; typparam = t; typparam1 = n; check_login_pop(1)*/ } } function commonPopRHS(e) { /*var t = ($ (window).height() – $ (“#” + e).height()) / 2 + $ (window).scrollTop(); var n = ($ (window).width() – $ (“#” + e).width()) / 2 + $ (window).scrollLeft(); $ (“#” + e).css({ position: “absolute”, top: t, left: n }); $ (“#lightbox_cb,#” + e).fadeIn(300); $ (“#lightbox_cb”).remove(); $ (“body”).append(”); $ (“#lightbox_cb”).css({ filter: “alpha(opacity=80)” }).fadeIn()*/ $ (“.linkSignUp”).click(); } function overlay(n) { document.getElementById(‘back’).style.width = document.body.clientWidth + “px”; document.getElementById(‘back’).style.height = document.body.clientHeight +”px”; document.getElementById(‘back’).style.display = ‘block’; jQuery.fn.center = function () { this.css(“position”,”absolute”); var topPos = ($ (window).height() – this.height() ) / 2; this.css(“top”, -topPos).show().animate({‘top’:topPos},300); this.css(“left”, ( $ (window).width() – this.width() ) / 2); return this; } setTimeout(function(){$ (‘#backInner’+n).center()},100); } function closeoverlay(n){ document.getElementById(‘back’).style.display = ‘none’; document.getElementById(‘backInner’+n).style.display = ‘none’; } stk_str=”; stk.forEach(function (stkData,index){ if(index==0){ stk_str+=stkData.stockId.trim(); }else{ stk_str+=’,’+stkData.stockId.trim(); } }); $ .get(‘//www.moneycontrol.com/techmvc/mc_apis/stock_details/?sc_id=’+stk_str, function(data) { stk.forEach(function (stkData,index){ $ (‘#stock-name-‘+stkData.stockId.trim()+’-‘+article_id).text(data[stkData.stockId.trim()][‘nse’][‘shortname’]); }); }); function redirectToTradeOpenDematAccountOnline(){ if (stock_isinid && stock_tradeType) { window.open(`https://www.moneycontrol.com/open-demat-account-online?classic=true&script_id=$ {stock_isinid}&ex=$ {stock_tradeType}&site=web&asset_class=stock&utm_source=moneycontrol&utm_medium=articlepage&utm_campaign=tradenow&utm_content=webbutton`, ‘_blank’); } }
Bulls returned to Dalal Street in the last week of 2022 after being battered by bears in the previous three weeks. The Nifty50 has taken support at 17,770 and rebounded sharply to close with nearly 300 points gains at 18,105 during the week ended December 30, driven by value buying in beaten-down quality stocks. After hitting record high of 18,887 on December 1, the index had corrected more than 1,000 points before smart recovery.
The index has formed a bullish candle after three back-to-back red candles, which resembles a Bullish Harami kind of pattern on the weekly scale, indicating the signs of more optimism after smart recovery. In fact, it is a bullish reversal pattern, hence 18,400-18,500 will be the crucial resistance area in the beginning week of New Year 2023 as crossing of which could push the index towards new high, with support at 18,000-17,800 area, experts said.
The momentum oscillator RSI (relative strength index – 14) above 55 is also indicating positive strength in the market in near term.
“After the recent price-wise correction in the market, the chart structure construes optimism, and it is highly anticipated to continue the cheerful run in the new calendar year. The broad-based buying in the last week has levitated market sentiments and can be seen as a sign of progression as we outclass our major global peers,” Osho Krishan, Senior Analyst – Technical and Derivative Research at Angel One, said.
The broader markets also performed strong and even better than benchmarks, as the Nifty Midcap 100 gained 4.5 percent and Smallcap 100 index rose 6 percent on strong breadth.
On the Options front, we have maximum Call Open interest at 19,000 strike, which is Out-Of-Money (OTM) indicating the traders are betting big on 19,000 mark again. OTM generally has more risk than ATM (at-the-money) Calls, whereas on the Put side, the maximum open interest was at 18,000 strike, suggesting crucial support area for the Nifty in January series.
As far as levels are concerned, Osho feels 18,000 is expected to cushion any short-term blip, with the sacrosanct support placed around 17,800 for the time being. While on the higher end, a decisive move above 18,400-18,450 would affirm the continuation of the uptrend in the market, he said.
Going forward, he remains sanguine with the current momentum, and advised traders to utilize the dips to add long positions in the index in the comparable period.
Also, he expects strong moves in the broader market. So one needs to have a stock-centric approach for better trading opportunities, he advised.
Let’s take a look at the top 10 trading ideas by experts for the next three-four weeks. Returns are based on the December 30 closing prices:
Expert: Shrikant Chouhan, Head of Equity research (Retail) at Kotak Securities
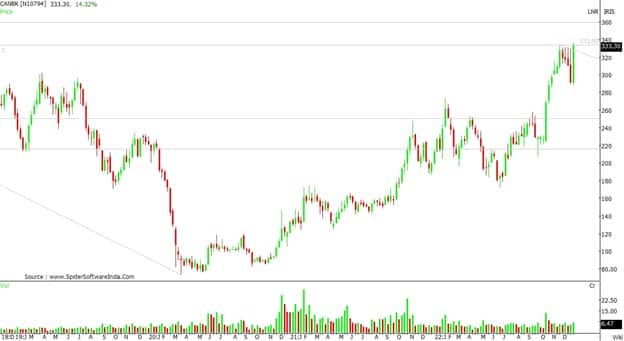
Canara Bank: Buy | LTP: Rs 333.3 | Stop-Loss: Rs 315 | Target: Rs 365 | Return: 9.5 percent
The stock corrected to Rs 285 level which was due, however, the correction was bigger and faster than the expectations from Rs 334 level. In the past week, the stock crossed highs of a bullish corrective move, which is a sign of an impulse wave in progress.
Above Rs 334 level, the next major resistance lies between Rs 360-365 levels, which is the 38.20 percent retracement level of the entire downtrend of the last few years.
The strategy should be to buy at the current levels and buy if it hits Rs 325, with a stop-loss at Rs 315.
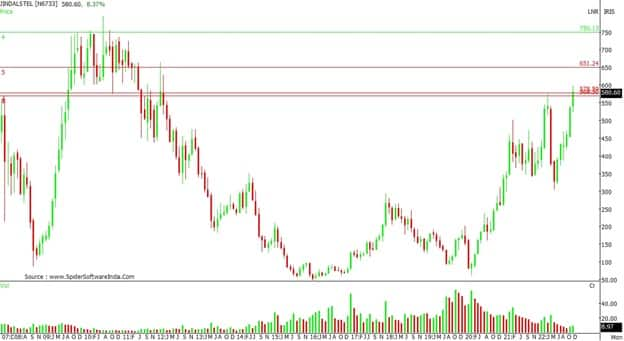
Jindal Steel & Power: Buy | LTP: Rs 580.6 | Stop-Loss: Rs 550 | Target: Rs 650 | Return: 12 percent
The recent sell-off in metal stocks pulled the stock from Rs 580 levels to Rs 300 which was significant, however, when it bounced back, it crossed the highs of the previous up move. It means that the stock is strong and is still following the primary trend which is to the upside.
At the same time, it crossed Rs 580 level and started following a broad pattern again.
In the long term, the stock may retest the previous highs which are near Rs 750 level. However, the stock may touch Rs 650 in the near term. Buy 50 percent at Rs 580 and the rest at Rs 565, with a stop-loss at Rs 550.
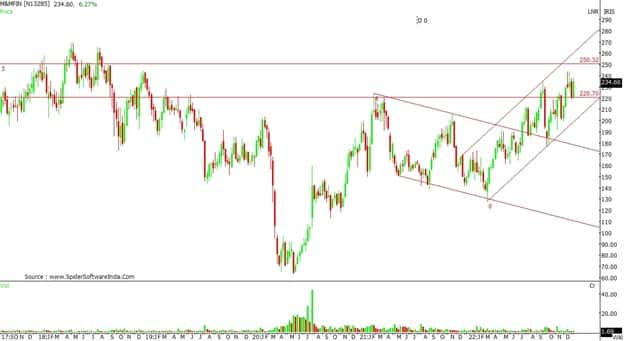
M&M Financial Services: Buy | LTP: Rs 234.6 | Stop-Loss: Rs 215 | Target: Rs 290 | Return: 6.5 percent
The stock is moving towards Rs 290 level, which will take some more months. In between, without a corrective pattern, we cannot see an upward movement.
In the last three weeks, the stock came back to the corrective level which was around Rs 220. The trading pattern is suggesting an upside movement in the near term, which will push the stock towards Rs 250.
However, for this, we need to place a stop-loss at Rs 215 for the same. Below Rs 215 levels, the stock may again slide towards Rs 200. The barriers will be at Rs 240 and Rs 250. Buy is advised at Rs 234 and Rs 225.
Expert: Nandish Shah, Senior Derivative & Technical Analyst at HDFC Securities
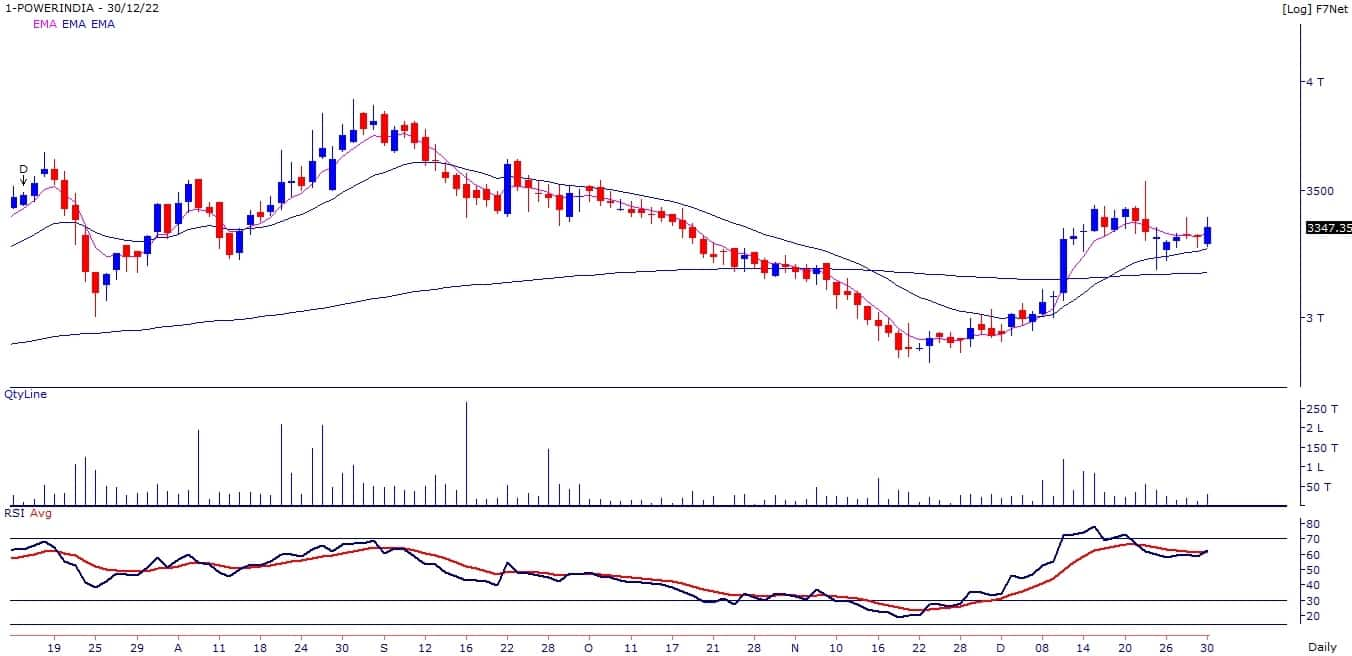
Hitachi Energy India: Buy | LTP: Rs 3,347 | Stop-Loss: Rs 3,150 | Target: Rs 3,580-3,700 | Return: 11 percent
Accumulation has seen in the stock during December where volumes were higher on up days as compared to down days. Primary trend of stock turned positive as stock price crossed 200-day moving average.
Momentum Oscillators – RSI (relative strength index – 11) is placed above 60 on the daily chart, indicating relative strength in the stock. After breaking out on the daily chart on December 12, the stock price is consolidating which we believe is a buying opportunity. One can buy the stock in the range of Rs 3,347-3,250.
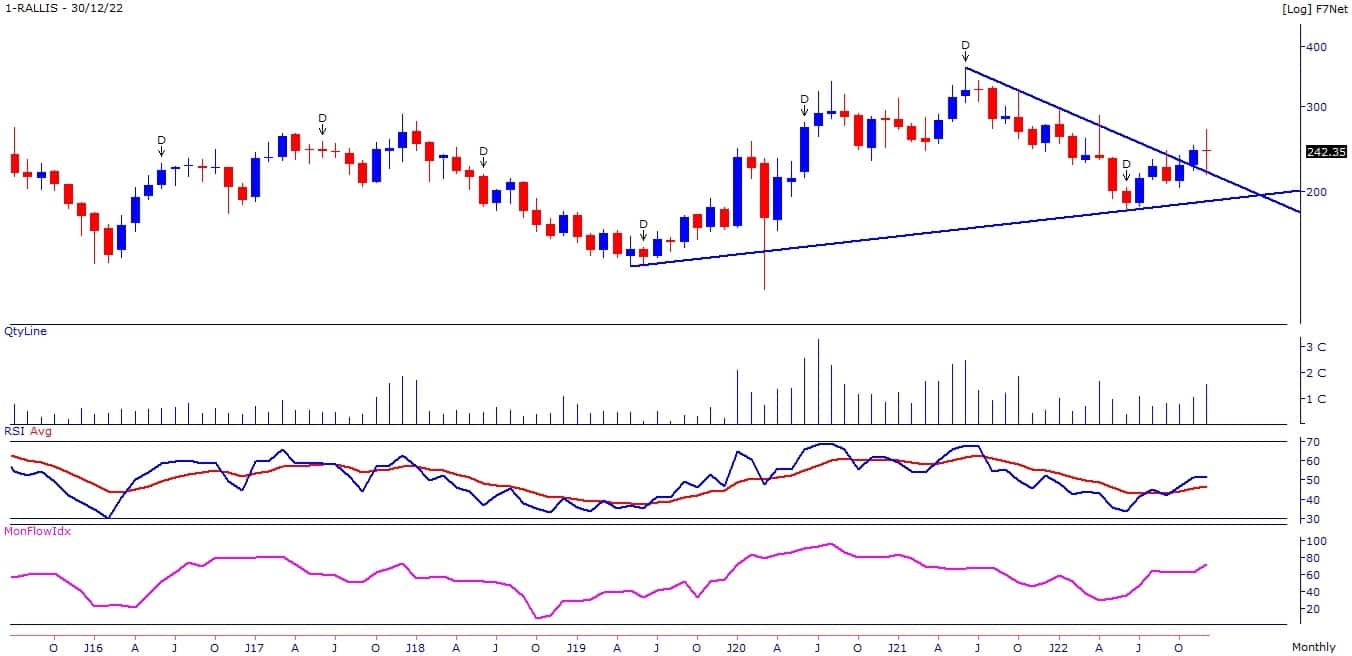
Rallis India: Buy | LTP: Rs 242.35 | Stop-Loss: Rs 225 | Target: Rs 262-275 | Return: 13 percent
The stock price has broken out on the monthly chart from the downward sloping trendline. Short term trend of the stock turned positive as stock price has crossed its 5 and 20-day EMA (exponential moving average).
Primary trend of stock remains positive as it is trading above its 100 and 200-day moving averages. Momentum Oscillators – RSI (11) has started rising and crossed the signal line on the daily chart, indicating strength in the stock. One can buy the stock in the range of Rs 242-235.
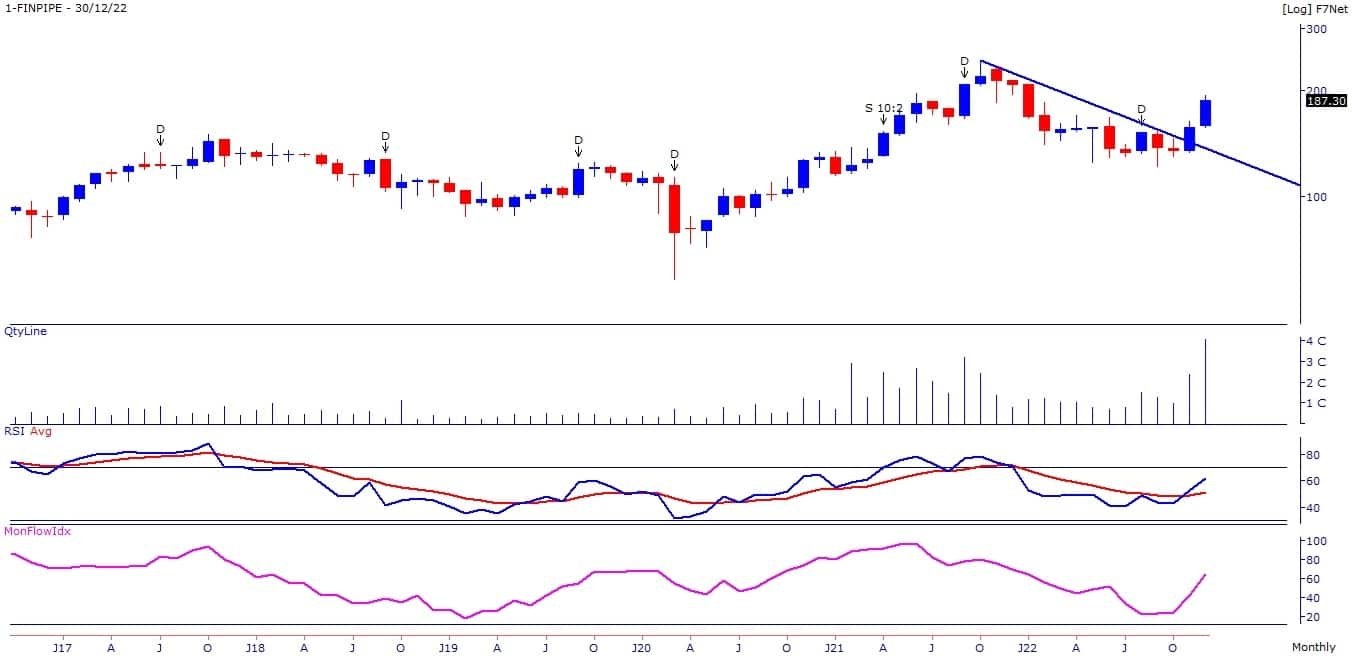
Finolex Industries: Buy | LTP: Rs 187.3 | Stop-Loss: Rs 173 | Target: Rs 201-210 | Return: 12 percent
The stock price has broken out on the monthly chart from the downward sloping trendline in November and witnessed follow up buying in December to close at highest level since December 2021.
The stock price has surpassed the multiple top resistance placed around Rs 165 levels. Primary trend of stock remains positive as it is trading above its 50, 100 and 200-day moving averages.
Momentum Oscillators – RSI (11) and MFI (10) is placed above 60 on the daily and weekly chart, indicating relative strength in the stock. One can buy the stock in the range of Rs 186-180.
Expert: Jatin Gohil, Technical and Derivative Research Analyst at Reliance Securities
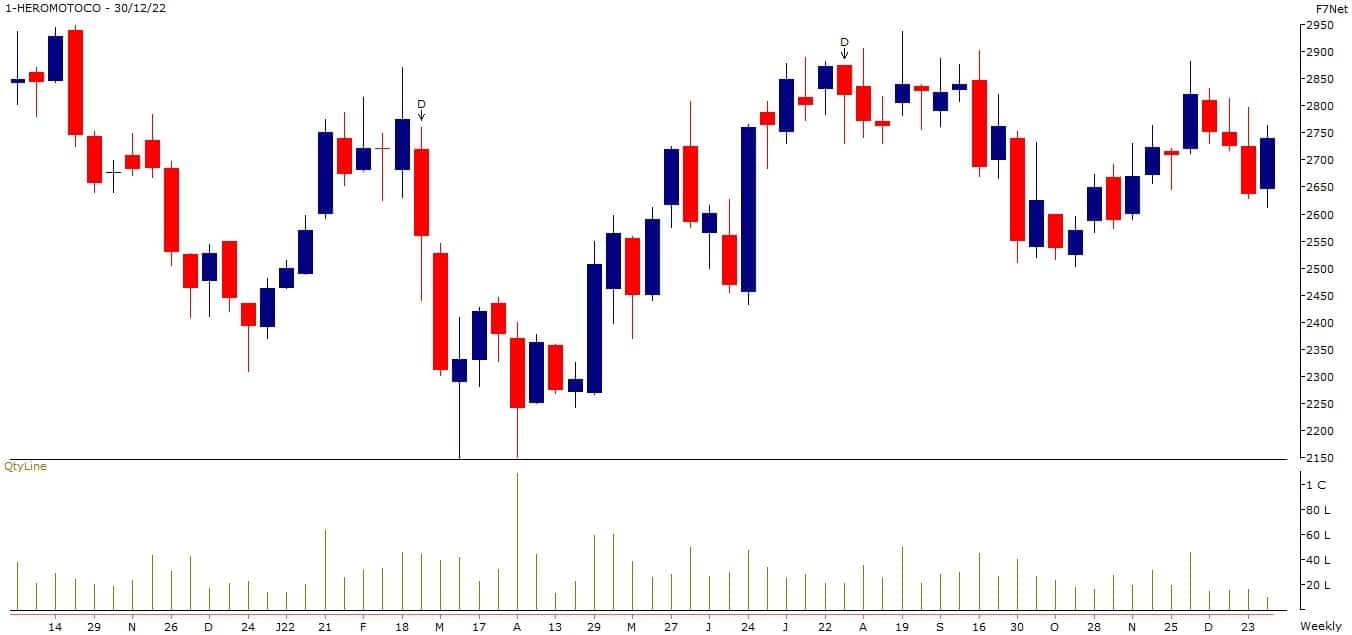
Hero MotoCorp: Buy | LTP: Rs 2,739 | Stop-Loss: Rs 2,619 | Target: Rs 2,935 | Return: 7 percent
The stock breached its prior weekly falling trend and formed a bullish reversal pattern. We believe the stock could move towards its highest level of mid-August 2022.
The key technical indicators reversed before testing the oversold zone on short-term timeframe chart and gave buy signal.
In case of any decline, its prior swing low will work as a key reversal point for the stock.
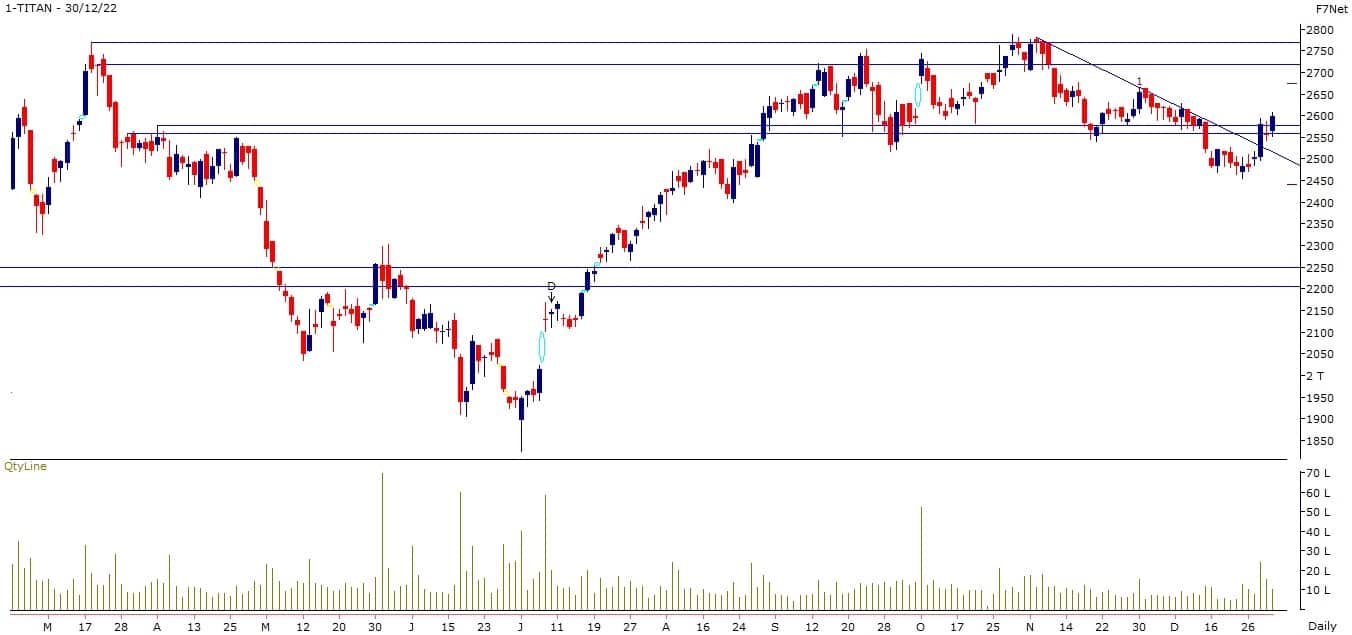
Titan Company: Buy | LTP: Rs 2,597.5 | Stop Loss: Rs 2,470 | Target: Rs 2,765 | Return: 6.5 percent
On December 28, 2022, the stock witnessed a trendline breakout with relatively higher volume. The stock has potential to move towards its prior multiple highs.
Its daily technical indiators are in favour of the bulls. On the lower side, its extended trendline will restrict the fall.
Expert: Rohan Shah, Head of Technical Analyst at Stoxbox
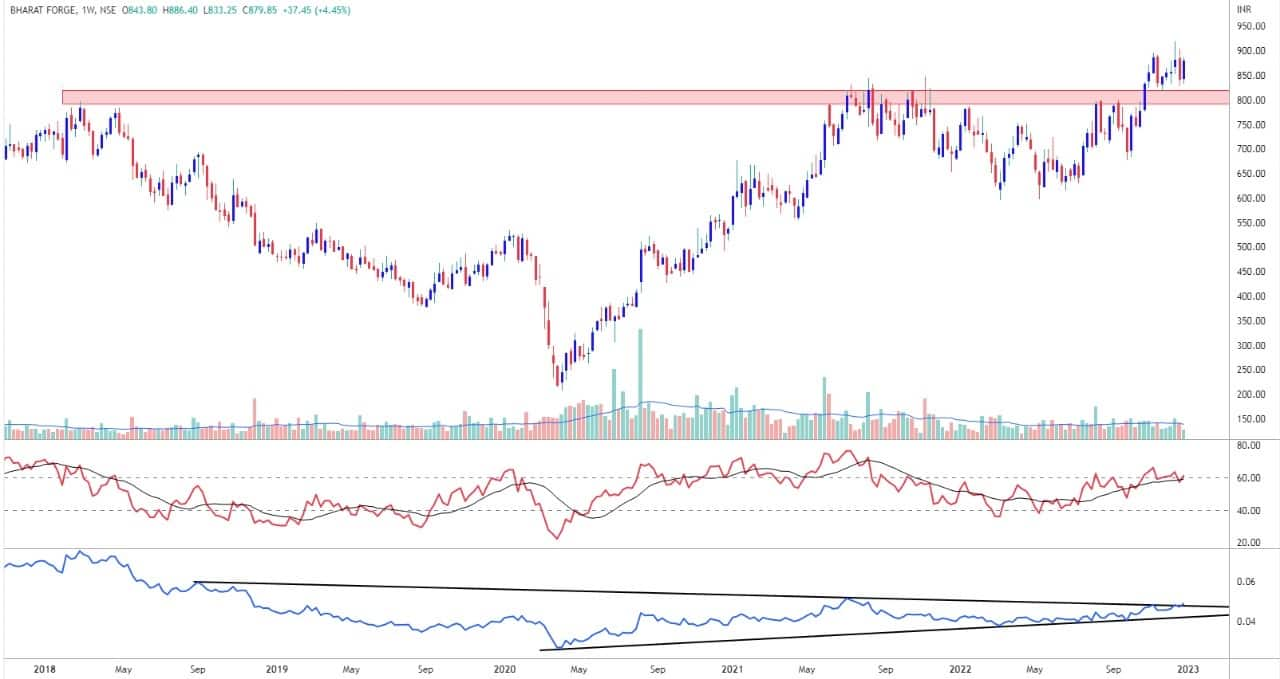
Bharat Forge: Buy | LTP: Rs 880 | Stop-Loss: Rs 838 | Target: Rs 965 | Return: 10 percent
The stock has surpassed multi-month supply zone of Rs 820-800 and comfortably trading above the same signaling price has entered into elevated trading orbit highlighting bullish bias in price.
In the lower time frame chart, around the supply zone, price has registered breakout from potential cup and handle pattern thus adding further confirmation.
The breakout has accompanied with sizeable volumes and bullish wide candlestick denotes dominance of bulls over bears.
The Relative Strength Line against Nifty has resolute breakout from the symmetrical triangle pattern which is bullish sign and indicates stock likely to outperform the head index.
The momentum indicator RSI, inching higher taking support at 60 levels and converging around its averages validates bullish bias.
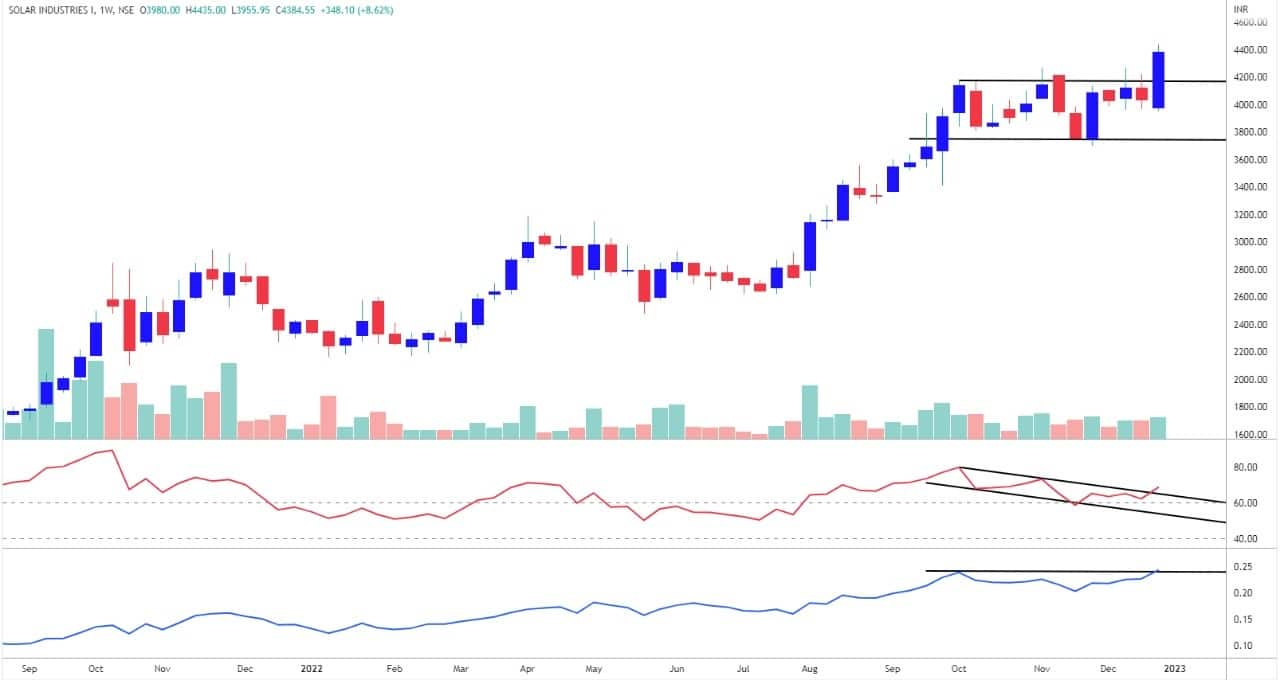
Solar Industries: Buy | LTP: Rs 4,384.5 | Stop-Loss: Rs 4,174 | Target: Rs 4,800 | Return: 9.5 percent
Post sharp up move from Rs 2,630 to Rs 4,200 in the period of 3 months price; the stock went into hibernation mode for multiple weeks.
The consolidation has concluded a breakout on the higher side which denotes resumption in the prior trend.
The breakout has occurred with strong bullish candle and supportive volumes thus increases the reliability of the breakout.
The Relative Strength line against Nifty has surpassed its previous pivot level and trading at all-time high hints the strength and momentum in price.
The momentum indicator RSI, rebounded higher from the 60 levels and has resulted breakout from intermediate falling channel compliments bullish view on price.
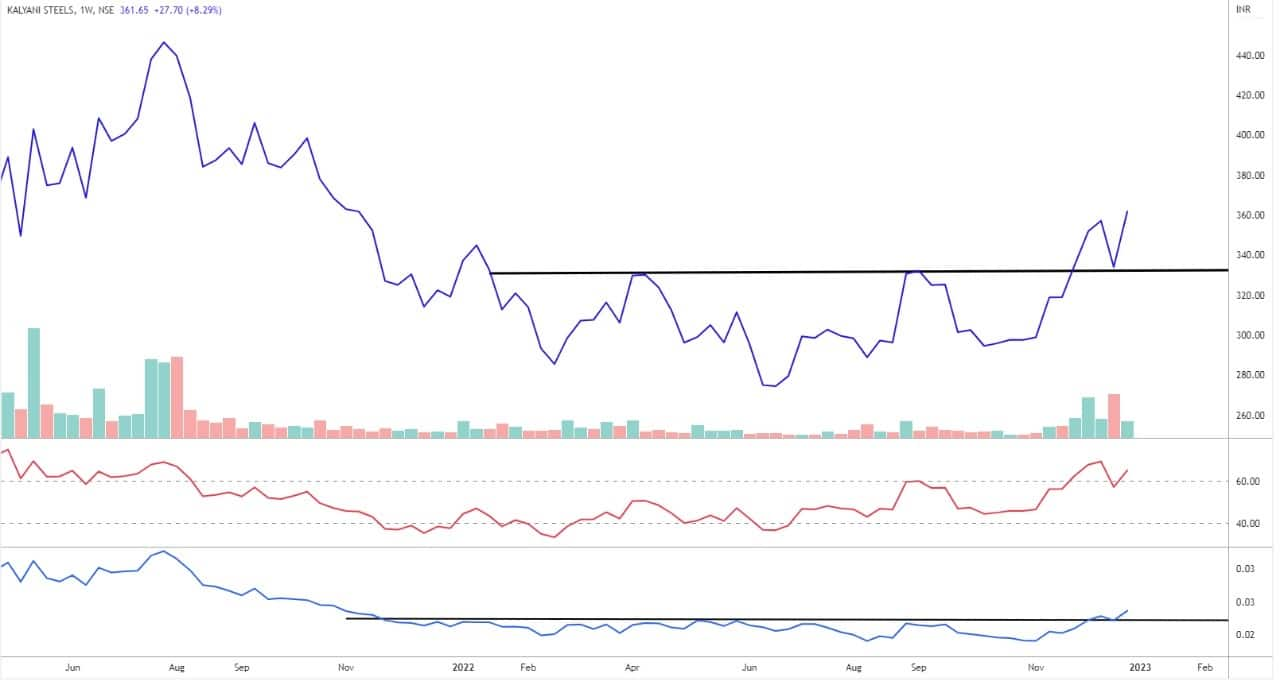
Kalyani Steels: Buy | LTP: Rs 361.65 | Stop-Loss: Rs 343 | Target: Rs 410 | Return: 13 percent
Recently the stock lodged a breakout from Inverse Head & Shoulder price pattern which indicates bullish reversal in price.
Post breakout price retraced lower and rebounded strongly retesting the neckline of the breakout which is bullish signal for medium term trend.
The breakout has accompanied with above average volumes and post breakout the volumes have increased substantially indicates participants’ interest in the stock.
The Relative Strength Line against Nifty500 has resulted a breakout from the multi-month horizontal resistance line highlights strength in price and suggests stock likely to outperform Nifty500 index.
The momentum indicator RSI shows range shift to the elevated readings and has surpassed 60 levels, thus indicates strong momentum in price.
Disclaimer: The views and investment tips expressed by investment experts on Moneycontrol.com are their own and not those of the website or its management. Moneycontrol.com advises users to check with certified experts before taking any investment decisions.