Chances look bright for the Nifty50 to move towards the record high of 18,604 in the coming days if the momentum sustains and global markets support, with crucial support at the psychological 18,000 mark, said experts. They advise to continue with the ‘buy on dips’ strategy
Sunil Shankar Matkar
November 14, 2022 / 10:10 AM IST

‘); $ (‘#lastUpdated_’+articleId).text(resData[stkKey][‘lastupdate’]); //if(resData[stkKey][‘percentchange’] > 0){ // $ (‘#greentxt_’+articleId).removeClass(“redtxt”).addClass(“greentxt”); // $ (‘.arw_red’).removeClass(“arw_red”).addClass(“arw_green”); //}else if(resData[stkKey][‘percentchange’] < 0){ // $ (‘#greentxt_’+articleId).removeClass(“greentxt”).addClass(“redtxt”); // $ (‘.arw_green’).removeClass(“arw_green”).addClass(“arw_red”); //} if(resData[stkKey][‘percentchange’] >= 0){ $ (‘#greentxt_’+articleId).removeClass(“redtxt”).addClass(“greentxt”); //$ (‘.arw_red’).removeClass(“arw_red”).addClass(“arw_green”); $ (‘#gainlosstxt_’+articleId).find(“.arw_red”).removeClass(“arw_red”).addClass(“arw_green”); }else if(resData[stkKey][‘percentchange’] < 0){ $ (‘#greentxt_’+articleId).removeClass(“greentxt”).addClass(“redtxt”); //$ (‘.arw_green’).removeClass(“arw_green”).addClass(“arw_red”); $ (‘#gainlosstxt_’+articleId).find(‘.arw_green’).removeClass(“arw_green”).addClass(“arw_red”); } $ (‘#volumetxt_’+articleId).show(); $ (‘#vlmtxt_’+articleId).show(); $ (‘#stkvol_’+articleId).text(resData[stkKey][‘volume’]); $ (‘#td-low_’+articleId).text(resData[stkKey][‘daylow’]); $ (‘#td-high_’+articleId).text(resData[stkKey][‘dayhigh’]); $ (‘#rightcol_’+articleId).show(); }else{ $ (‘#volumetxt_’+articleId).hide(); $ (‘#vlmtxt_’+articleId).hide(); $ (‘#stkvol_’+articleId).text(”); $ (‘#td-low_’+articleId).text(”); $ (‘#td-high_’+articleId).text(”); $ (‘#rightcol_’+articleId).hide(); } $ (‘#stk-graph_’+articleId).attr(‘src’,’//appfeeds.moneycontrol.com/jsonapi/stocks/graph&format=json&watch_app=true&range=1d&type=area&ex=’+stockType+’&sc_id=’+stockId+’&width=157&height=100&source=web’); } } } }); } $ (‘.bseliveselectbox’).click(function(){ $ (‘.bselivelist’).show(); }); function bindClicksForDropdown(articleId){ $ (‘ul#stockwidgettabs_’+articleId+’ li’).click(function(){ stkId = jQuery.trim($ (this).find(‘a’).attr(‘stkid’)); $ (‘ul#stockwidgettabs_’+articleId+’ li’).find(‘a’).removeClass(‘active’); $ (this).find(‘a’).addClass(‘active’); stockWidget(‘N’,stkId,articleId); }); $ (‘#stk-b-‘+articleId).click(function(){ stkId = jQuery.trim($ (this).attr(‘stkId’)); stockWidget(‘B’,stkId,articleId); $ (‘.bselivelist’).hide(); }); $ (‘#stk-n-‘+articleId).click(function(){ stkId = jQuery.trim($ (this).attr(‘stkId’)); stockWidget(‘N’,stkId,articleId); $ (‘.bselivelist’).hide(); }); } $ (“.bselivelist”).focusout(function(){ $ (“.bselivelist”).hide(); //hide the results }); function bindMenuClicks(articleId){ $ (‘#watchlist-‘+articleId).click(function(){ var stkId = $ (this).attr(‘stkId’); overlayPopupWatchlist(0,2,1,stkId); }); $ (‘#portfolio-‘+articleId).click(function(){ var dispId = $ (this).attr(‘dispId’); pcSavePort(0,1,dispId); }); } $ (‘.mc-modal-close’).on(‘click’,function(){ $ (‘.mc-modal-wrap’).css(‘display’,’none’); $ (‘.mc-modal’).removeClass(‘success’); $ (‘.mc-modal’).removeClass(‘error’); }); function overlayPopupWatchlist(e, t, n,stkId) { $ (‘.srch_bx’).css(‘z-index’,’999′); typparam1 = n; if(readCookie(‘nnmc’)) { var lastRsrs =new Array(); lastRsrs[e]= stkId; if(lastRsrs.length > 0) { var resStr=”; var url = ‘//www.moneycontrol.com/mccode/common/saveWatchlist.php’; $ .get( “//www.moneycontrol.com/mccode/common/rhsdata.html”, function( data ) { $ (‘#backInner1_rhsPop’).html(data); $ .ajax({url:url, type:”POST”, dataType:”json”, data:{q_f:typparam1,wSec:secglbVar,wArray:lastRsrs}, success:function(d) { if(typparam1==’1′) // rhs { var appndStr=”; var newappndStr = makeMiddleRDivNew(d); appndStr = newappndStr[0]; var titStr=”;var editw=”; var typevar=”; var pparr= new Array(‘Monitoring your investments regularly is important.’,’Add your transaction details to monitor your stock`s performance.’,’You can also track your Transaction History and Capital Gains.’); var phead =’Why add to Portfolio?’; if(secglbVar ==1) { var stkdtxt=’this stock’; var fltxt=’ it ‘; typevar =’Stock ‘; if(lastRsrs.length>1){ stkdtxt=’these stocks’; typevar =’Stocks ‘;fltxt=’ them ‘; } } //var popretStr =lvPOPRHS(phead,pparr); //$ (‘#poprhsAdd’).html(popretStr); //$ (‘.btmbgnwr’).show(); var tickTxt =’‘; if(typparam1==1) { var modalContent = ‘Watchlist has been updated successfully.’; var modalStatus = ‘success’; //if error, use ‘error’ $ (‘.mc-modal-content’).text(modalContent); $ (‘.mc-modal-wrap’).css(‘display’,’flex’); $ (‘.mc-modal’).addClass(modalStatus); //var existsFlag=$ .inArray(‘added’,newappndStr[1]); //$ (‘#toptitleTXT’).html(tickTxt+typevar+’ to your watchlist’); //if(existsFlag == -1) //{ // if(lastRsrs.length > 1) // $ (‘#toptitleTXT’).html(tickTxt+typevar+’already exist in your watchlist’); // else // $ (‘#toptitleTXT’).html(tickTxt+typevar+’already exists in your watchlist’); // //} } //$ (‘.accdiv’).html(”); //$ (‘.accdiv’).html(appndStr); } }, //complete:function(d){ // if(typparam1==1) // { // watchlist_popup(‘open’); // } //} }); }); } else { var disNam =’stock’; if($ (‘#impact_option’).html()==’STOCKS’) disNam =’stock’; if($ (‘#impact_option’).html()==’MUTUAL FUNDS’) disNam =’mutual fund’; if($ (‘#impact_option’).html()==’COMMODITIES’) disNam =’commodity’; alert(‘Please select at least one ‘+disNam); } } else { AFTERLOGINCALLBACK = ‘overlayPopup(‘+e+’, ‘+t+’, ‘+n+’)’; commonPopRHS(); /*work_div = 1; typparam = t; typparam1 = n; check_login_pop(1)*/ } } function pcSavePort(param,call_pg,dispId) { var adtxt=”; if(readCookie(‘nnmc’)){ if(call_pg == “2”) { pass_sec = 2; } else { pass_sec = 1; } var url = ‘//www.moneycontrol.com/mccode/common/saveWatchlist.php’; $ .ajax({url:url, type:”POST”, //data:{q_f:3,wSec:1,dispid:$ (‘input[name=sc_dispid_port]’).val()}, data:{q_f:3,wSec:pass_sec,dispid:dispId}, dataType:”json”, success:function(d) { //var accStr= ”; //$ .each(d.ac,function(i,v) //{ // accStr+=”+v.nm+”; //}); $ .each(d.data,function(i,v) { if(v.flg == ‘0’) { var modalContent = ‘Scheme added to your portfolio.’; var modalStatus = ‘success’; //if error, use ‘error’ $ (‘.mc-modal-content’).text(modalContent); $ (‘.mc-modal-wrap’).css(‘display’,’flex’); $ (‘.mc-modal’).addClass(modalStatus); //$ (‘#acc_sel_port’).html(accStr); //$ (‘#mcpcp_addportfolio .form_field, .form_btn’).removeClass(‘disabled’); //$ (‘#mcpcp_addportfolio .form_field input, .form_field select, .form_btn input’).attr(‘disabled’, false); // //if(call_pg == “2”) //{ // adtxt =’ Scheme added to your portfolio We recommend you add transactional details to evaluate your investment better. x‘; //} //else //{ // adtxt =’ Stock added to your portfolio We recommend you add transactional details to evaluate your investment better. x‘; //} //$ (‘#mcpcp_addprof_info’).css(‘background-color’,’#eeffc8′); //$ (‘#mcpcp_addprof_info’).html(adtxt); //$ (‘#mcpcp_addprof_info’).show(); glbbid=v.id; } }); } }); } else { AFTERLOGINCALLBACK = ‘pcSavePort(‘+param+’, ‘+call_pg+’, ‘+dispId+’)’; commonPopRHS(); /*work_div = 1; typparam = t; typparam1 = n; check_login_pop(1)*/ } } function commonPopRHS(e) { /*var t = ($ (window).height() – $ (“#” + e).height()) / 2 + $ (window).scrollTop(); var n = ($ (window).width() – $ (“#” + e).width()) / 2 + $ (window).scrollLeft(); $ (“#” + e).css({ position: “absolute”, top: t, left: n }); $ (“#lightbox_cb,#” + e).fadeIn(300); $ (“#lightbox_cb”).remove(); $ (“body”).append(”); $ (“#lightbox_cb”).css({ filter: “alpha(opacity=80)” }).fadeIn()*/ $ (“#myframe”).attr(‘src’,’https://accounts.moneycontrol.com/mclogin/?d=2′); $ (“#LoginModal”).modal(); } function overlay(n) { document.getElementById(‘back’).style.width = document.body.clientWidth + “px”; document.getElementById(‘back’).style.height = document.body.clientHeight +”px”; document.getElementById(‘back’).style.display = ‘block’; jQuery.fn.center = function () { this.css(“position”,”absolute”); var topPos = ($ (window).height() – this.height() ) / 2; this.css(“top”, -topPos).show().animate({‘top’:topPos},300); this.css(“left”, ( $ (window).width() – this.width() ) / 2); return this; } setTimeout(function(){$ (‘#backInner’+n).center()},100); } function closeoverlay(n){ document.getElementById(‘back’).style.display = ‘none’; document.getElementById(‘backInner’+n).style.display = ‘none’; } stk_str=”; stk.forEach(function (stkData,index){ if(index==0){ stk_str+=stkData.stockId.trim(); }else{ stk_str+=’,’+stkData.stockId.trim(); } }); $ .get(‘//www.moneycontrol.com/techmvc/mc_apis/stock_details/?sc_id=’+stk_str, function(data) { stk.forEach(function (stkData,index){ $ (‘#stock-name-‘+stkData.stockId.trim()+’-‘+article_id).text(data[stkData.stockId.trim()][‘nse’][‘shortname’]); }); }); function redirectToTradeOpenDematAccountOnline(){ if (stock_isinid && stock_tradeType) { window.open(`https://www.moneycontrol.com/open-demat-account-online?classic=true&script_id=$ {stock_isinid}&ex=$ {stock_tradeType}&site=web&asset_class=stock&utm_source=moneycontrol&utm_medium=articlepage&utm_campaign=tradenow&utm_content=webbutton`, ‘_blank’); } }
Bulls retained their might for the fourth straight week ended November 11, taking the Nifty50 to its peak for this year so far on the back of a rally in its global peers. The upbeat sentiment in the market was fuelled by the hope of a slowdown in rate hikes by the Federal Reserve after inflation in the US began cooling off.
The Nifty50 rallied more than 200 points or 1 percent to settle the week at 18,350, backed by technology, banking and financial services and metal stocks. The index has seen a bullish candlestick pattern on the weekly scale, with a higher-high-higher-low formation for the fourth consecutive week.
Momentum indicators MACD (moving average convergence and divergence) and RSI (relative strength index) also indicated the positive mood in the market. Hence, the chances look bright for the Nifty50 to move towards a record high of 18,604 in the coming days if the momentum sustains and global markets support, with crucial support at the psychological 18,000 mark, said experts. They advised to continue with the ‘buy on dips’ strategy.
“The price configuration looks promising, too, because the Nifty finally managed to surpass the time-tested trendline resistance above 18,200–18,000 with some authority,” Sameet Chavan, Chief Analyst-Technical and Derivatives at Angel One, said.
For the coming week, he feels 18,200–18,000 would now be seen as a sacrosanct support zone, whereas on the flipside, testing 18,450 and 18,600 is clearly on the cards. In fact, if the momentum persists, the Nifty will see a fresh record high in the coming week itself.
Till now, most of the other heavyweights have been driving the markets higher but with the IT space coming out of its long slumber, the rally is likely to be robust in nature, Chava said.
The broader markets were under pressure with the Nifty Midcap 100 and Smallcap 100 indices falling 1 percent and half a percent respectively.
Hence, instead of anticipating reversals in the underperformers, traders should look to ride the trend with the heavyweights or sectors which are participating in this up-move, and look for buying opportunities from a short-term perspective, Ruchit Jain, Lead Research at 5paisa.com, advised.
Let’s take a look at the top 10 trading ideas by experts for the next three-four weeks. Returns are based on the November 11 closing prices:
Expert: Shrikant Chouhan, Head of Equity Research (Retail) at Kotak Securities
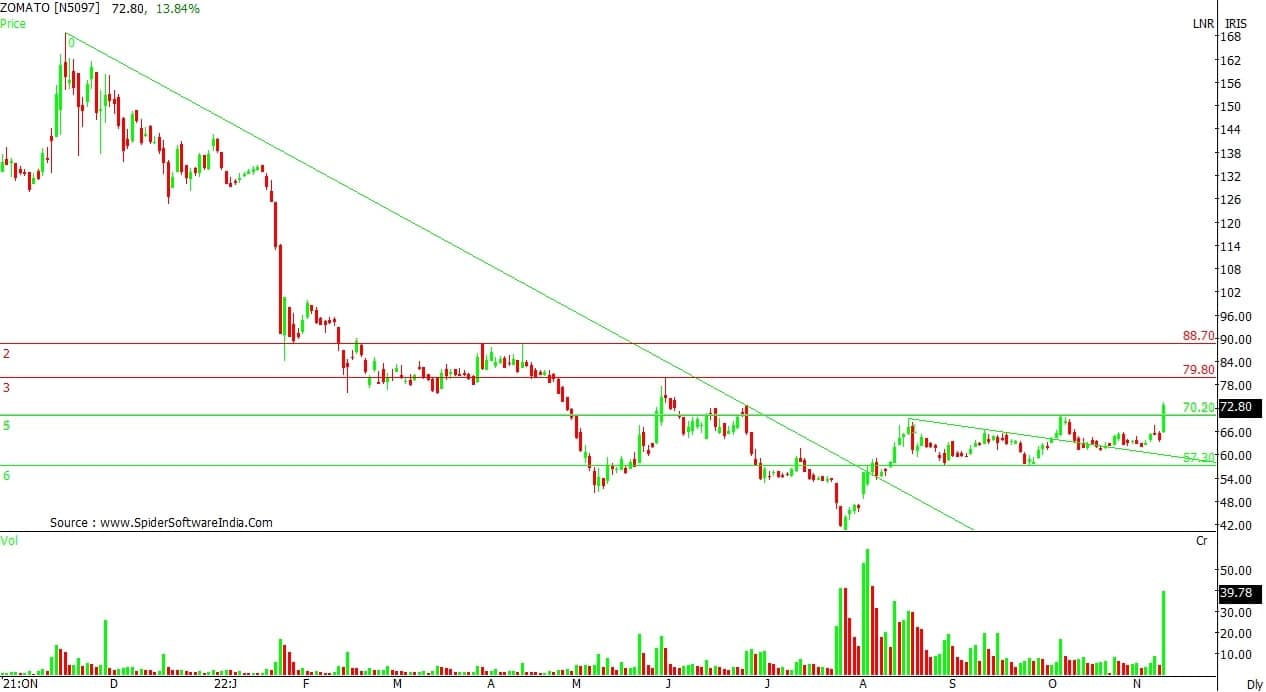
Zomato: Buy | LTP: Rs 72.80 | Stop-Loss: Rs 67 | Target: Rs 90 | Return: 24 percent
The stock completed a sideways corrective pattern on last Friday and closed above the upper band of the trading range, which was at Rs 70.
Based on that the stock should move towards Rs 90 level with minor resistance at Rs 80. It is a price and volume-based break out for the stock, which signals the start of an impulse-up move.
One can buy 50 percent quantity at Rs 73 and the remaining 50 percent at Rs 69 with a stop-loss at Rs 67.
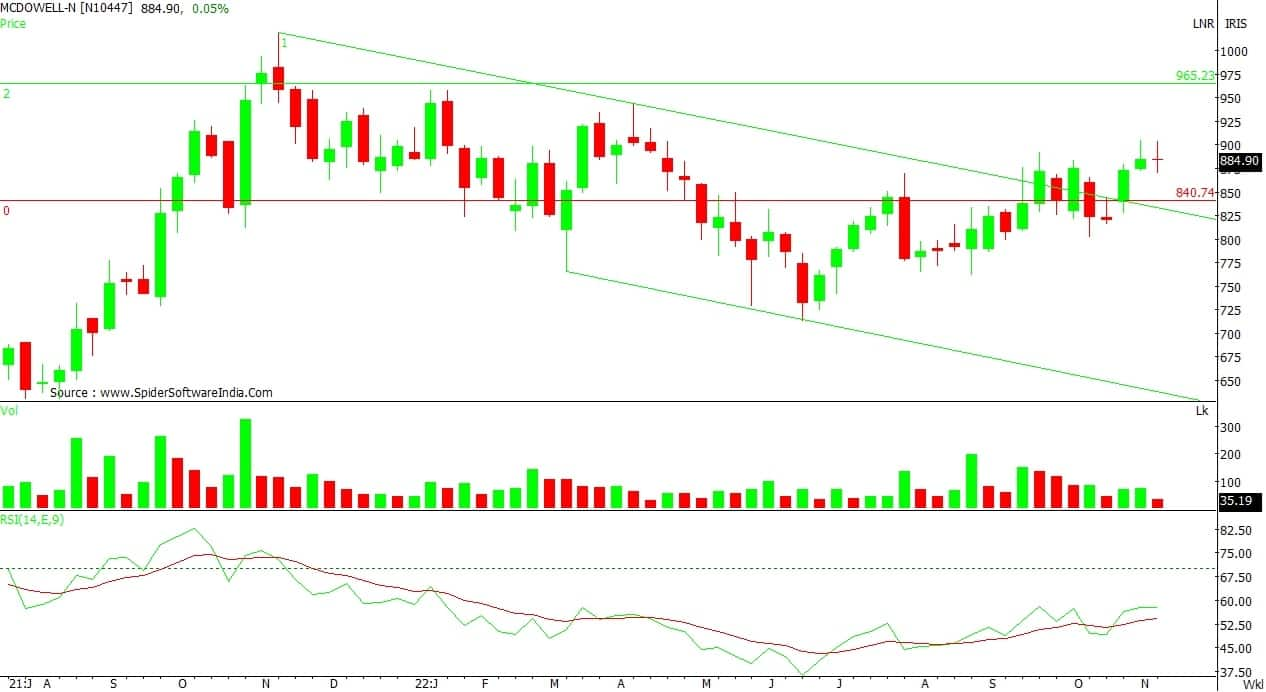
United Spirits: Buy | LTP: Rs 885 | Stop-Loss: Rs 860 | Target: Rs 960 | Return: 8.5 percent
Since the stock has broken the resistance of the falling trend line, it is consolidating at the upper band of the rectangle formation, which is suggesting that the stock is ready to surpass the upward boundary, which is at Rs 905.
On the dismissal of Rs 905, the stock would move toward the levels of Rs 925 and Rs 960. It’s a buy at current levels as the risk to the reward is decent. One can buy at current levels and keep a stop-loss at Rs 860 for the same.
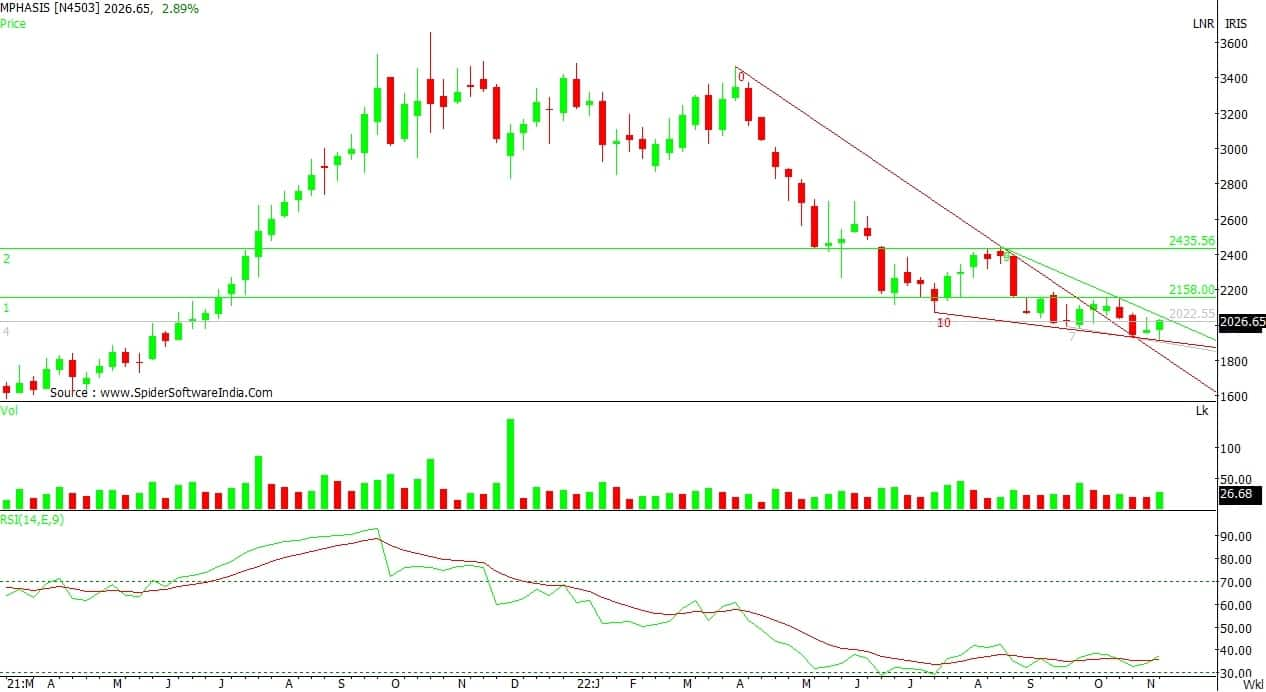
Mphasis: Buy | LTP: Rs 2,027 | Stop-Loss: Rs 1,900 | Target: Rs 2,400 | Return: 18 percent
The stock is turning positive on the weekly chart. With a positive divergence, it is on track to complete a falling wedge (a bullish consolidation), which would pull the stock towards Rs 2,400 in the medium term.
It is advisable to buy at the current level with a final stop-loss at Rs 1,900. On the upside, resistance will be at Rs 2,150 and Rs 2,400.
Expert: Nagaraj Shetti, Technical Research Analyst at HDFC Securities
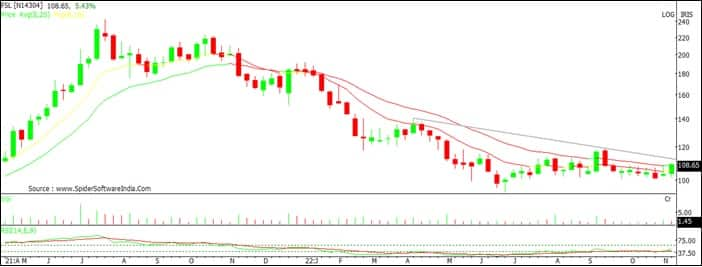
Firstsource Solutions: Buy | LTP: Rs 109 | Stop-Loss: Rs 101 | Target: Rs 125 | Return: 15 percent
After showing a rangebound action in the last 5-6 weeks, the stock price has witnessed a sharp upside bounce last week and closed higher. The stock price is currently placed at the resistance of 20-week EMA (exponential moving average) around Rs 108.50 and further upside from here could bring another hurdle of down sloping trend line at Rs 112 in the near term.
Volume has expanded during upmove on last Friday and weekly RSI (relative strength index) shows positive indication. Hence, one may expect further strengthening of upside momentum in the stock price ahead.
Buying can be initiated in Firstsource at current market price (Rs 109), add more on dips down to Rs 104.50, wait for the upside targets of Rs Rs 117 and next Rs 125 in the next 3-5 weeks, with a stop-loss of Rs 101.
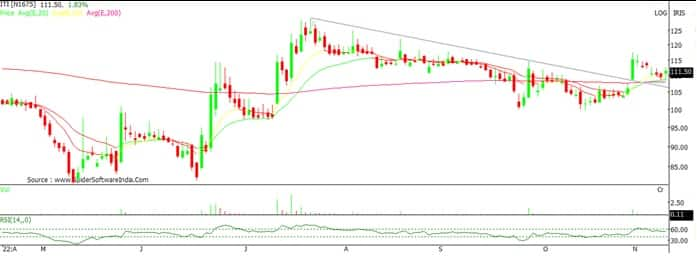
ITI: Buy | LTP: Rs 111 | Stop-Loss: Rs 104 | Target: Rs 126 | Return: 13 percent
After witnessing a sharp upside breakout of down sloping trend line resistance on November 1 at Rs 108 levels, the stock price has shifted into a consolidation with minor downward correction in the next 5-6 sessions.
The recent minor downward correction seems to have completed and the stock price is now ready to show another round of sharp upside bounce from the higher lows. The recent weakness has not negated the upside breakout of the down trend line. The daily RSI shows positive indication and one may expect continuation of upside momentum in the near term.
Buying can be initiated in ITI at current market price (Rs 111), add more on dips down to Rs 107 and wait for the upside targets of Rs 120 and next Rs 126 in the next 3-5 weeks, with a stop-loss of Rs 104.
Expert: Jatin Gohil – Technical and Derivative Research Analyst at Reliance Securities
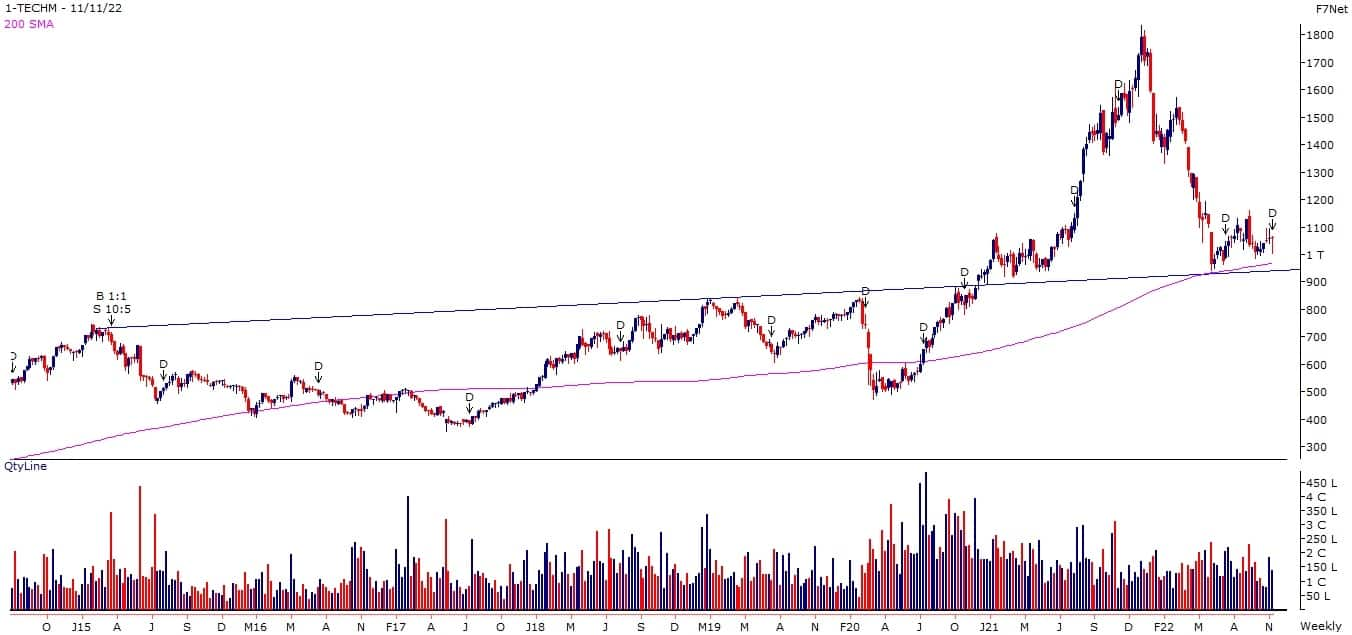
Tech Mahindra: Buy | LTP: Rs 1,059 | Stop-Loss: Rs 968 | Target: Rs 1,360 | Return: 28 percent
After a higher level of reversal, the stock tested its prior high’s connecting rising trendline and respecting its long-term moving average (200-week SMA) oscillated upwards.
We believe the stock is poised for a breakout, which could take it towards Rs 1,330-1,360 zone.
In the past, reversal from its long-term moving average has supported a health up-move.
The key technical indicators are in favour of the bulls on short-term timeframe chart.
In case of any decline, the stock will respect its long-term moving average.
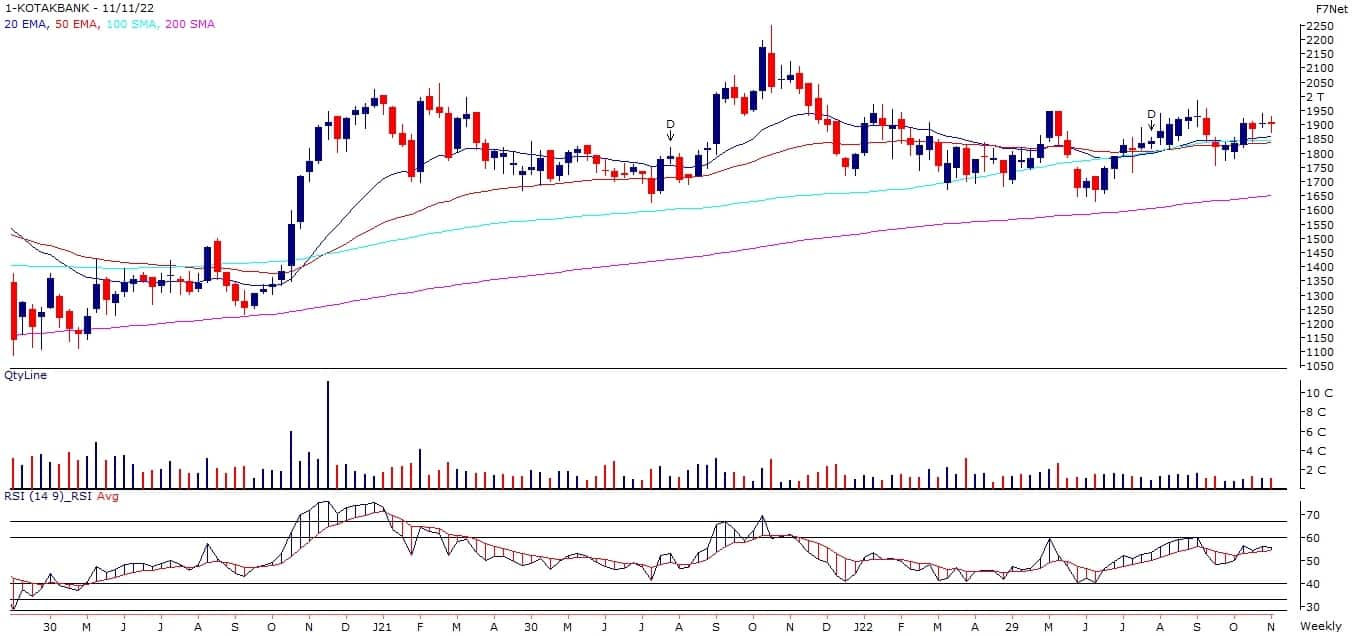
Kotak Mahindra Bank: Buy | LTP: Rs 1,899 | Stop-Loss: Rs 1,740 | Target: Rs 2,180 | Return: 15 percent
The stock has made higher bottoms on the weekly chart with an inside range and trending in a narrow range confirms a breakout.
Its weekly RSI has turned upwards from the lower part of the range and other key technical indicators on near-term timeframe chart are positively poised.
The stock has a strong support near its multi band of moving averages on the weekly time scale and the strong positive momentum in the sector reinforces our positive stance.
Therefore, we recommend directional long position for a target of Rs 2,180 with a stop-loss of Rs 1,740.
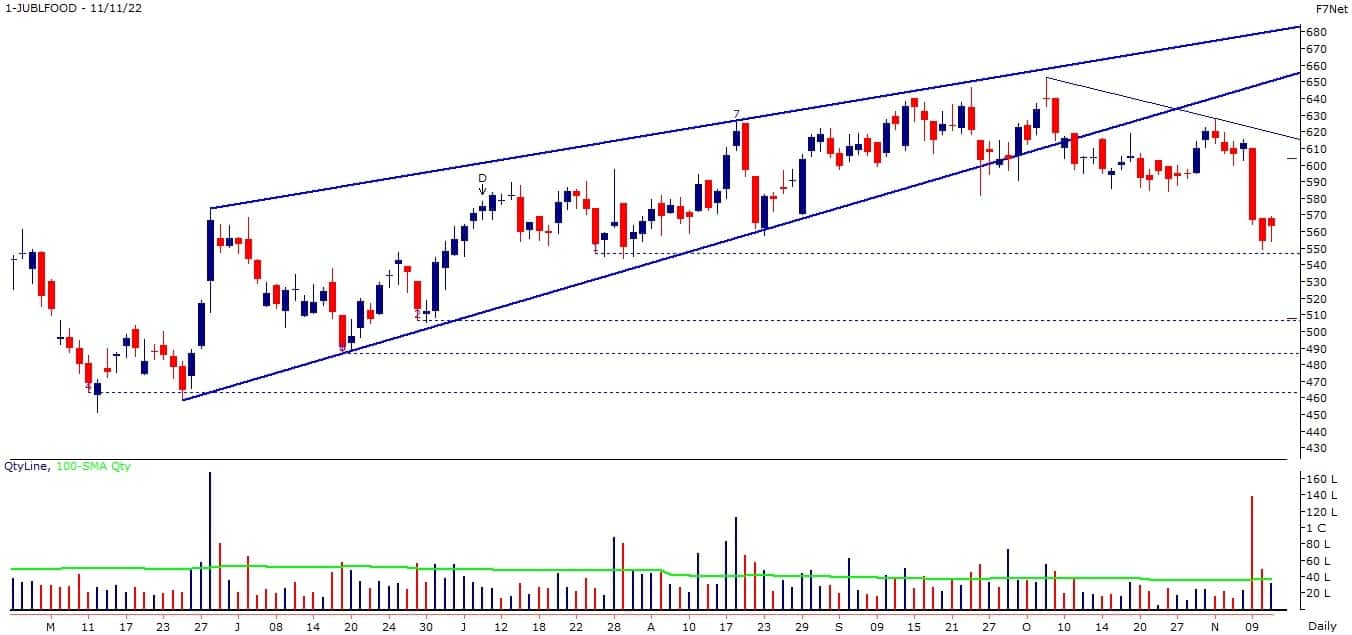
Jubilant Foodworks Future: Sell | LTP: Rs 566 | Stop-Loss: Rs 617 | Target: 463 | Return: 18 percent
In second week of October 2022, the stock witnessed a breakdown from rising wedge pattern and after sluggish movement, it has extended loss with above average volume.
On the lower side, the stock may find support around Rs 547, as multiple lows formed at around that level.
The key technical indicators gave sell signal post bearish divergence on the short-term timeframe chart.
This could drag the stock below its near-term support of Rs 547 and could move it towards Rs 506-487-463.
On the higher side, the stock will face hurdle around its prior highs (Rs 652 and Rs 628) connecting intermediate falling trendline.
Thus, a short position can be initiated for the target of Rs 463 with a stop-loss of Rs 617.
Expert: Jigar S Patel, Senior Manager – Equity Research at Anand Rathi Shares & Stock Brokers
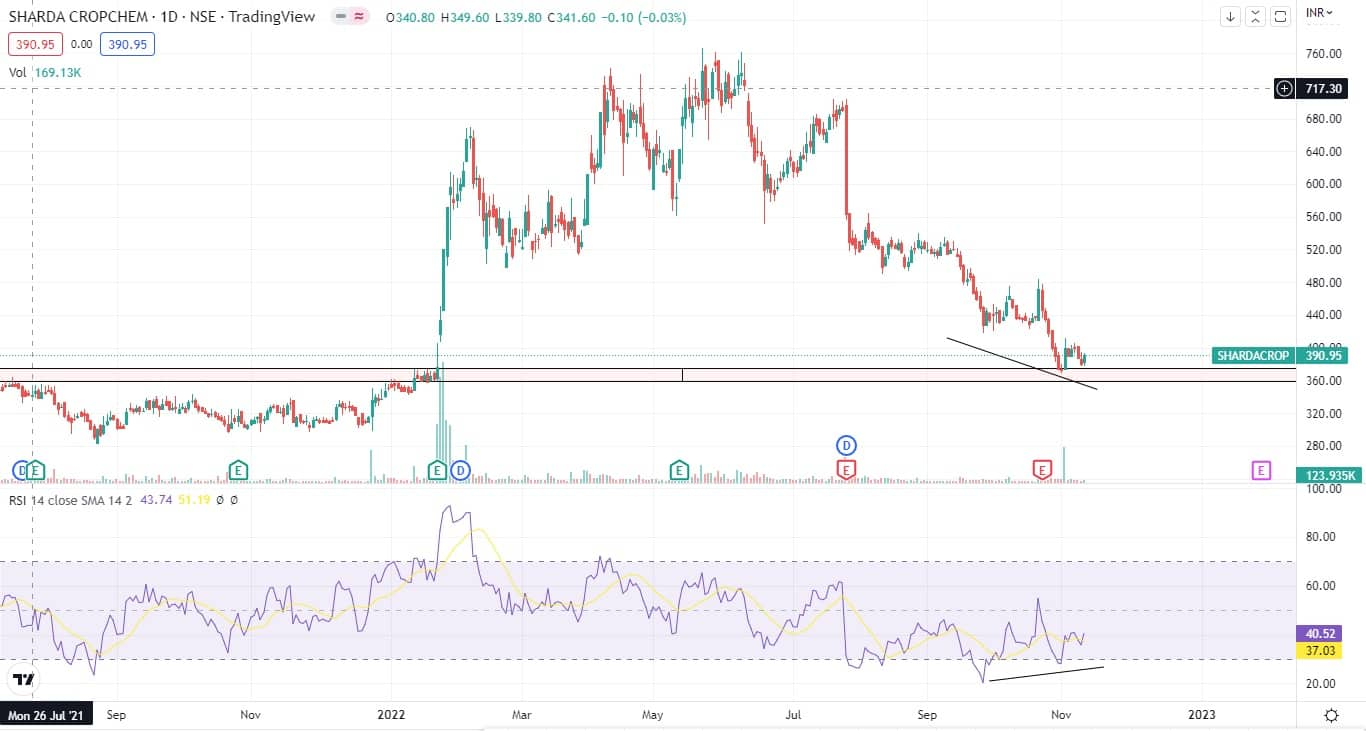
Sharda Cropchem: Buy | LTP: Rs 391 | Stop-Loss: Rs 350 | Target: Rs 480 | Return: 23 percent
The free fall started from July 2022 till October 2022 which resulted in a 47 percent decline in price. On a daily scale, the counter has formed classic Doji near its historical support of Rs 375 along with drying volume which indicates that bears are losing grip.
In the previous trading session, the said counter witnessed nice buying interest supported by sufficient volume which is adding more confirmation for early reversal in the counter.
On the indicator front, the daily RSI (relative strength index) has formed a bullish divergence near the oversold zone (refer to the chart) which further confirms the upside in the counter.
One can buy in small tranches at current levels and buy another tranche at around Rs 370 levels (if tested). The upside is expected till Rs 480 and support is around Rs 350.
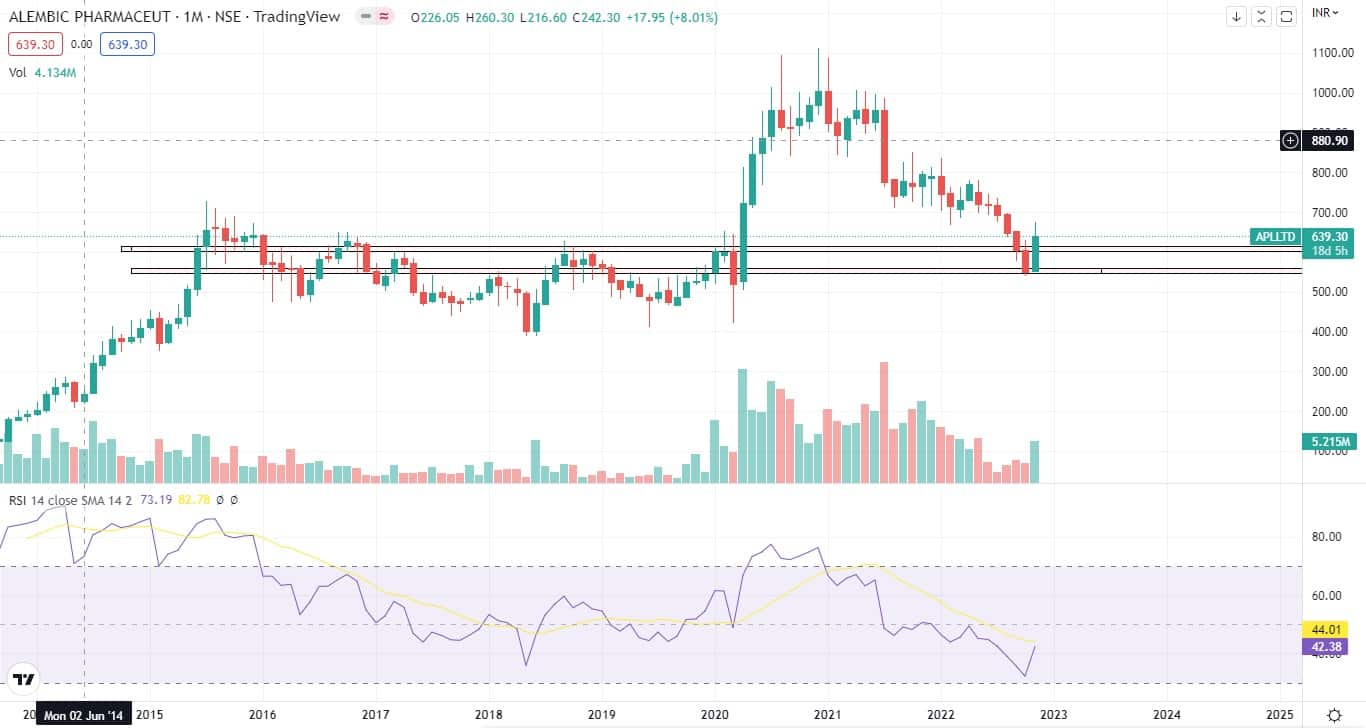
Alembic Pharmaceuticals: Buy | LTP: Rs 639 | Stop-Loss: Rs 570 | Target: Rs 750 | Return: 17 percent
On a monthly scale after hitting an all-time high of Rs 1,111, the counter nosedived to Rs 540 levels which accounted for a 51 percent depreciation in price.
Even on a daily scale, negative volume is drying up indicating possible upside momentum.
On the indicator front, the monthly RSI has formed an impulsive structure near the oversold zone which further confirms the upside in the counter. One can buy at current levels, the upside expected is Rs 750 and credible support is at Rs 570.
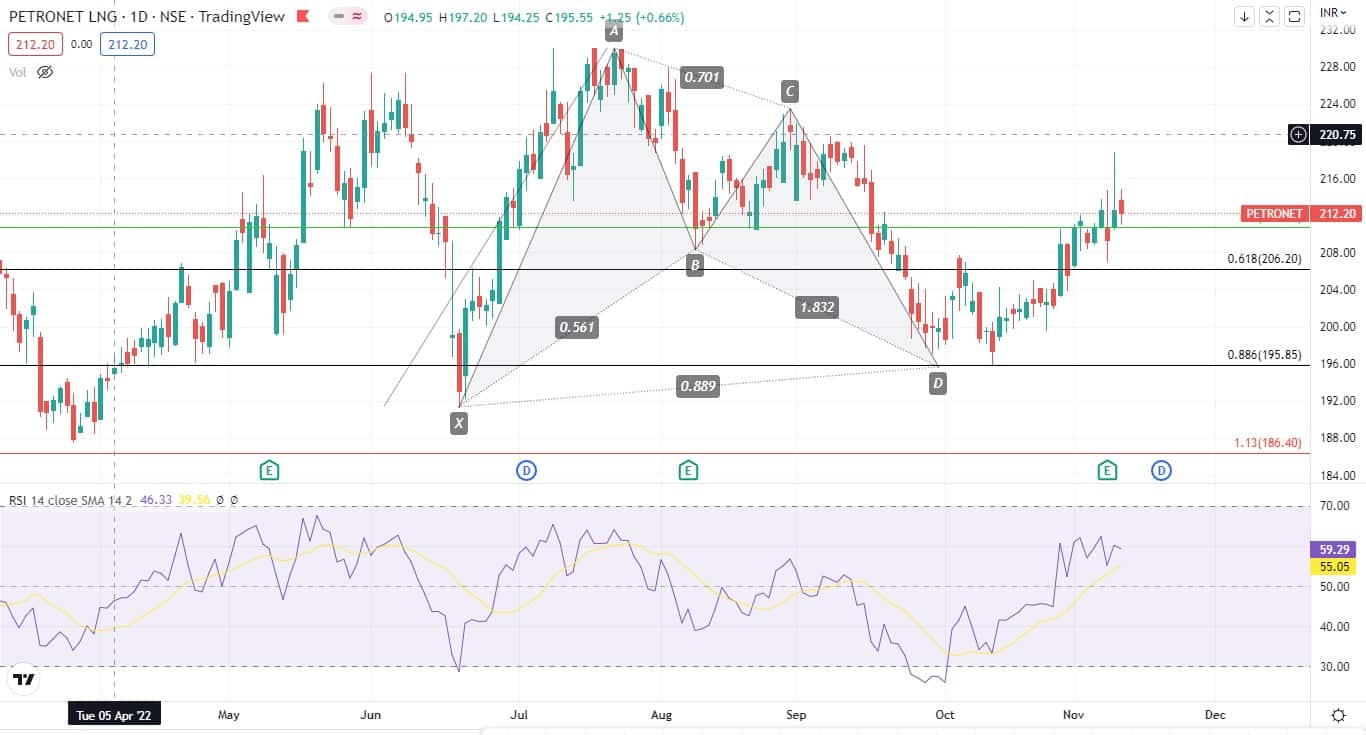
Petronet LNG: Buy | LTP: Rs 212 | Stop-Loss: Rs 200 | Target: Rs 235 | Return: 11 percent
Petronet has witnessed a very sharp correction of 14 percent between July 2022 and September 2022. Since then the stock is consolidating between Rs 200-205 on the hourly scale and it has made a solid base near Rs 203 levels.
On October 3, 2022, it completed a bullish BAT pattern near said range along with the complex structure on daily RSI which hints towards a possible reversal in the counter.
One can hold (if already bought) and add (if considering fresh buy) in the range Rs 211-213. The upside is expected till Rs 235 with a stop-loss of Rs 200 on a closing basis.
Disclaimer: The views and investment tips expressed by investment experts on Moneycontrol.com are their own and not those of the website or its management. Moneycontrol.com advises users to check with certified experts before taking any investment decisions.