
Rajesh Palviya of Axis Securities
Rajesh Palviya of Axis Securities says his bias is still positive but there may be sector rotation within this bull market, so he advises traders to buy on dips. The short- to medium-term trend remains intact and the bullish command will take the Nifty 50 towards 18,300-18,600, the technical expert said.
On the downside, the immediate support is at 17,800-17,500, below which the index could fall towards 17,200 in the short term, said the vice president – research (head technical & derivatives) at Axis Securities, with over 20 years of experience.
On the monthly time frame, the Nifty IT index formed a bullish candle that engulfed the previous month, indicating a potential positive reversal signal, he told Moneycontrol in an interview. The index is taking support at 27,000 but one can start building a position once it closes above 30,000 with a strict stop-loss of 27,000, he said. Edited excerpts:
The PSU Bank index was the biggest gainer in the rally of the last three weeks. Do you expect the run-up to go on or is it looking overbought?
The biggest recovery was in banking stocks, especially PSU banks, on account of their robust quarterly performance, led by a superior asset quality trend and the pickup in credit growth. A significant portion of new industrial loans was extended as working capital loans. Loan growth to the private corporate sector turned positive after two successive years of decline and deleveraging. The asset quality of small commercial banks (SCBs) continued to improve steadily through the year, with the gross non-performing assets (GNPA) ratio declining.
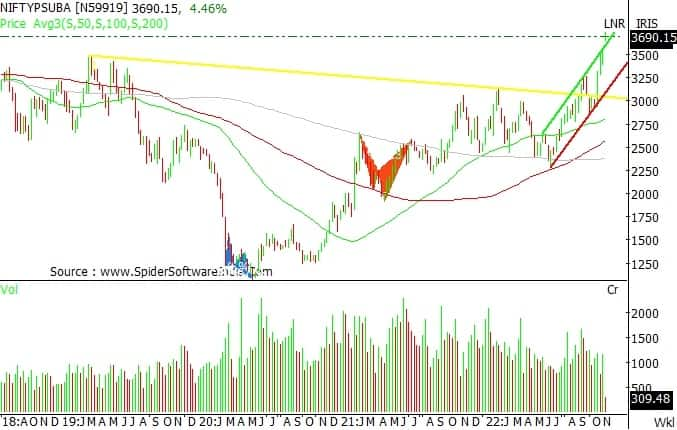
The Nifty PSU Bank index formed a higher high formation for the fourth consecutive month, indicating a sustained uptrend. The PSU Bank index has formed a bullish candle on the weekly chart, with a lower shadow that suggests buying interest at the lower side. The index is sustaining above all its important moving averages.
Also read: Nykaa shares suffer selling pressure as lock-in period expires tomorrow
The weekly chart breakout suggests that if the PSU Bank index continues to sustain above the 3,500 level, then it may scale up further towards 3,750-3,900 in the coming months. We expect the PSU Bank index to exhibit its upward momentum. One should use any decline as a buying opportunity in the PSU Bank index.
The Nifty FMCG index is one of the biggest gainers this calendar year. Will the momentum continue in the coming year too?
In the last three-four months, domestic-oriented themes such as banks, auto, FMCG, hospitals, domestic industrials, and discretionary have outperformed the export plus cyclical-oriented themes, with rising concerns over the global slowdown, aggressive tightening, and a preference for domestic interests first.
The second half of the year will be driven by the festive season and a normal monsoon that will give the necessary push to consumption patterns for the sector.
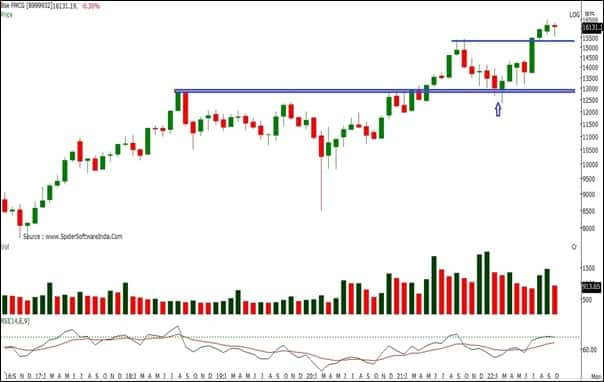
The index broke above the previous swing high with a strong bullish candle, indicating a strong positive upward momentum. The monthly price action has bounced from a major support, indicating buying at lower levels.
On the weekly timeframe, after a breakout, the index is consolidating between 16,500 and 15,500. Once 16,500 is taken out, it may head towards 17,500-18,000 levels. Hence, any correction towards the support zone of 15,500-15,000 level may remain a buying opportunity.
Also read: Mixed bag for India Inc in Q2 amid global headwinds, but local play stays strong
Is the Nifty IT index gradually gaining momentum? Also, is it time to take positions for longer time frames?
Some recovery was seen in the beaten-down IT sector, which reported a robust set of numbers, driven by large deal wins and notable demand for digital transformation. However, pressure continued on the margin front on account of higher travel costs and wage hikes. Supply-side constraints continue to pose challenges to growth in the short term.
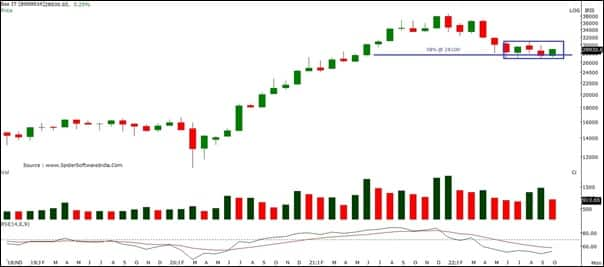
The index has been consolidating over the past five months in a range between 31,000 and 27,000. The index is facing stiff resistance at 31,000 while 27,000 is acting as a strong support. The index is also holding 38 percent Fibonacci retracement of a rally from 10,950-38,700 placed at 28,000 level.
On the monthly time frame, the index formed a bullish candle that engulfed the previous month, indicating a potential positive reversal signal. The index is taking support at 27,000 but one can start building a position once the index closes above 30,000 with a strict stop-loss of 27,000 levels.
Is the Nifty 50 preparing strong ground this time to reclaim earlier record highs in the coming weeks?
The Indian market performance has shown resilience in the past couple of months and has outperformed the major global markets by healthy margins, thanks to the country’s robust and superior economic outlook vis-à-vis other emerging markets. Since last Diwali, while the Nifty 50 has been up by 1 percent, the S&P 500 and Emerging Market index stand down by a whopping 16 percent and 31 percent, respectively.
Furthermore, on the last working day of October 2022, the Nifty 50 reclaimed its 18,000 mark, led by the outperformance of domestic-oriented themes over the cyclical plus export-oriented themes. Though September 2022 was a volatile month, which reported a rather mixed performance across the sectors and style indices, recovery was seen during October. This was led by positive global cues and robust festival demand.
In the last one month, large caps outperformed the broader market by healthy margins, primarily due to positive FII flows during the month. Nonetheless, in the near term, the Indian market will continue to follow the Q2FY23 earnings, macroeconomic data. FII flows may remain volatile and the market could witness higher volatility in the near term if pressure on the rupee continues. The Indian equity market is likely to outperform the global market over the medium to long term on account of its robust economic outlook.
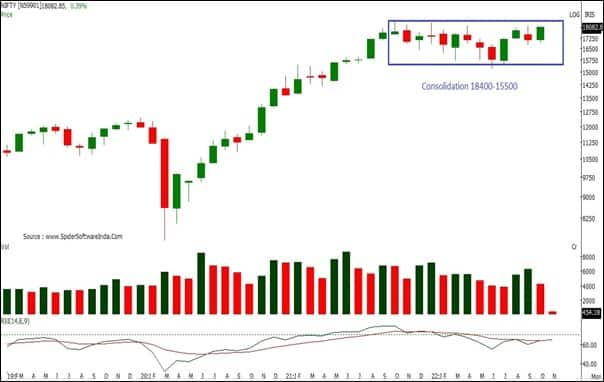
Since August 2021, the index has been consolidating within 18,400-15,500 levels, representing a sideways trend. The monthly price action has formed a sizable bullish candle… the trend may change once the index closes above 18,400. The monthly RSI (relative strength index) is flat, indicating sideways consolidation, whereas the weekly RSI is trending upward and quoting above its reference line, indicating that the trend is positive in the shorter timeframe.
The weekly ATR (average true range) has reached 440 points, which means that the Nifty currently has a range of 440 points for a given week. Although on the daily timeframe, it has declined throughout the month, with few ups and downs indicating there can be volatility expansion in the coming days. The India VIX (15.50) has declined around 22.38 percent, which means volatility has decreased.
The Nifty entered the multiple resistance zone between 18,000-18,500. Our bias still remains positive, but we may see a play of sector rotation within this bull market and hence traders are advised to buy on dips. From the current levels, the short- to medium-term trend still remains intact and the bulls could continue their bullish command into the markets towards 18,300-18,600 levels.
Decisively closing above 18,400 can open a higher side range towards 18,600-18,750. On the downside, immediate support is placed at 17,800-17,500 levels. However, any violation of this support zone on a closing basis may cause a short-term correction towards 17,200 levels.
Do you expect US oil futures to go back above $ 100 a barrel soon, considering the chart structure?
On the monthly charts, WTI crude oil futures closed in the green last month and edged above the 20-day EMA (exponential moving average), which clearly indicates that bulls are in the driving seat. If we talk about weekly charts, crude oil started last week with an upward gap, and buying momentum for the most part of the week led it to close on a strong note.
Prices settled at around $ 92.6 a barrel and it moved higher by 5 percent on a weekly basis. The daily and weekly RSI are moving upwards and quoting above their reference line, indicating a positive bias. Moreover, on the daily chart, it has closed above the upper Bollinger band, indicating high volatility on the upside. We have noticed that it is moving in a Higher Top and Higher Bottom formation on the daily chart, indicating a sustained uptrend.
Based on technical indicators, the long-term trend remains positive as long as $ 79 (50 percent retracement of its prior rally from $ 60 to $ 100) is not broken on the downside. Crude oil is approaching its three-month multiple support zone of $ 95, which remains a crucial level to watch out for.
The chart pattern suggests that if crude oil crosses and sustains above the $ 95 level, then prices may rally higher up to the $ 100 level. However, if it breaks below the $ 88 level, it would witness some selling, which would take it toward $ 85-$ 82.
What are the charts saying about the USD-INR direction, given that the currency has been consolidating between 82-83 for a month now?
On the monthly charts, USDINR spot has closed in the positive for nine consecutive months, which clearly shows the bulls have been commanding the move. If we move one time frame lower, that is to the weekly charts, the pair is denoting some sign of caution as its breaks below the three-week low. Also, the RSI has eased from the highs of 82 and the last time we saw this level in the RSI was in March 2020, when the pair corrected from a high of 77 to low of 72.30.
Moreover, on the daily charts, after the break above the 82 mark, the pair has been trading in the range 81.95 to 83.26, clearly denoting that the bulls have taken a breather and the bears are making some effort to fight back, which was confirmed by the ADX indicator that’s heading lower.
So to conclude, the long-term trend remains positive if 80.60 (24 percent retracement level drawn from the low of 72.26 and high of 83.26) is not broken on the downside. In the short term, we can see some correction till 81.30 and 80.60 if the pair breaks below 81.90.
Further, a break below 80.60 could have major bearish implications and prices could test 79 and 77.75 on the downside (50 percent and 62 percent retracement levels). On the other hand, as long as 80.60 is not broken on the downside a retest of 83.26 (all-time high) and a further break above the same USDINR could test 84.25 and 85.40 on the upside.
Disclaimer: The views and investment tips expressed by investment experts on Moneycontrol.com are their own and not those of the website or its management. Moneycontrol.com advises users to check with certified experts before taking any investment decisions.