EIH has broken out from the symmetrical triangle on the weekly chart with higher volumes. It has broken out on the daily chart on Monday to close at five days high.
Nandish Shah
October 04, 2022 / 06:30 AM IST

‘); $ (‘#lastUpdated_’+articleId).text(resData[stkKey][‘lastupdate’]); //if(resData[stkKey][‘percentchange’] > 0){ // $ (‘#greentxt_’+articleId).removeClass(“redtxt”).addClass(“greentxt”); // $ (‘.arw_red’).removeClass(“arw_red”).addClass(“arw_green”); //}else if(resData[stkKey][‘percentchange’] < 0){ // $ (‘#greentxt_’+articleId).removeClass(“greentxt”).addClass(“redtxt”); // $ (‘.arw_green’).removeClass(“arw_green”).addClass(“arw_red”); //} if(resData[stkKey][‘percentchange’] >= 0){ $ (‘#greentxt_’+articleId).removeClass(“redtxt”).addClass(“greentxt”); //$ (‘.arw_red’).removeClass(“arw_red”).addClass(“arw_green”); $ (‘#gainlosstxt_’+articleId).find(“.arw_red”).removeClass(“arw_red”).addClass(“arw_green”); }else if(resData[stkKey][‘percentchange’] < 0){ $ (‘#greentxt_’+articleId).removeClass(“greentxt”).addClass(“redtxt”); //$ (‘.arw_green’).removeClass(“arw_green”).addClass(“arw_red”); $ (‘#gainlosstxt_’+articleId).find(‘.arw_green’).removeClass(“arw_green”).addClass(“arw_red”); } $ (‘#volumetxt_’+articleId).show(); $ (‘#vlmtxt_’+articleId).show(); $ (‘#stkvol_’+articleId).text(resData[stkKey][‘volume’]); $ (‘#td-low_’+articleId).text(resData[stkKey][‘daylow’]); $ (‘#td-high_’+articleId).text(resData[stkKey][‘dayhigh’]); $ (‘#rightcol_’+articleId).show(); }else{ $ (‘#volumetxt_’+articleId).hide(); $ (‘#vlmtxt_’+articleId).hide(); $ (‘#stkvol_’+articleId).text(”); $ (‘#td-low_’+articleId).text(”); $ (‘#td-high_’+articleId).text(”); $ (‘#rightcol_’+articleId).hide(); } $ (‘#stk-graph_’+articleId).attr(‘src’,’//appfeeds.moneycontrol.com/jsonapi/stocks/graph&format=json&watch_app=true&range=1d&type=area&ex=’+stockType+’&sc_id=’+stockId+’&width=157&height=100&source=web’); } } } }); } $ (‘.bseliveselectbox’).click(function(){ $ (‘.bselivelist’).show(); }); function bindClicksForDropdown(articleId){ $ (‘ul#stockwidgettabs_’+articleId+’ li’).click(function(){ stkId = jQuery.trim($ (this).find(‘a’).attr(‘stkid’)); $ (‘ul#stockwidgettabs_’+articleId+’ li’).find(‘a’).removeClass(‘active’); $ (this).find(‘a’).addClass(‘active’); stockWidget(‘N’,stkId,articleId); }); $ (‘#stk-b-‘+articleId).click(function(){ stkId = jQuery.trim($ (this).attr(‘stkId’)); stockWidget(‘B’,stkId,articleId); $ (‘.bselivelist’).hide(); }); $ (‘#stk-n-‘+articleId).click(function(){ stkId = jQuery.trim($ (this).attr(‘stkId’)); stockWidget(‘N’,stkId,articleId); $ (‘.bselivelist’).hide(); }); } $ (“.bselivelist”).focusout(function(){ $ (“.bselivelist”).hide(); //hide the results }); function bindMenuClicks(articleId){ $ (‘#watchlist-‘+articleId).click(function(){ var stkId = $ (this).attr(‘stkId’); overlayPopupWatchlist(0,2,1,stkId); }); $ (‘#portfolio-‘+articleId).click(function(){ var dispId = $ (this).attr(‘dispId’); pcSavePort(0,1,dispId); }); } $ (‘.mc-modal-close’).on(‘click’,function(){ $ (‘.mc-modal-wrap’).css(‘display’,’none’); $ (‘.mc-modal’).removeClass(‘success’); $ (‘.mc-modal’).removeClass(‘error’); }); function overlayPopupWatchlist(e, t, n,stkId) { $ (‘.srch_bx’).css(‘z-index’,’999′); typparam1 = n; if(readCookie(‘nnmc’)) { var lastRsrs =new Array(); lastRsrs[e]= stkId; if(lastRsrs.length > 0) { var resStr=”; var url = ‘//www.moneycontrol.com/mccode/common/saveWatchlist.php’; $ .get( “//www.moneycontrol.com/mccode/common/rhsdata.html”, function( data ) { $ (‘#backInner1_rhsPop’).html(data); $ .ajax({url:url, type:”POST”, dataType:”json”, data:{q_f:typparam1,wSec:secglbVar,wArray:lastRsrs}, success:function(d) { if(typparam1==’1′) // rhs { var appndStr=”; var newappndStr = makeMiddleRDivNew(d); appndStr = newappndStr[0]; var titStr=”;var editw=”; var typevar=”; var pparr= new Array(‘Monitoring your investments regularly is important.’,’Add your transaction details to monitor your stock`s performance.’,’You can also track your Transaction History and Capital Gains.’); var phead =’Why add to Portfolio?’; if(secglbVar ==1) { var stkdtxt=’this stock’; var fltxt=’ it ‘; typevar =’Stock ‘; if(lastRsrs.length>1){ stkdtxt=’these stocks’; typevar =’Stocks ‘;fltxt=’ them ‘; } } //var popretStr =lvPOPRHS(phead,pparr); //$ (‘#poprhsAdd’).html(popretStr); //$ (‘.btmbgnwr’).show(); var tickTxt =’‘; if(typparam1==1) { var modalContent = ‘Watchlist has been updated successfully.’; var modalStatus = ‘success’; //if error, use ‘error’ $ (‘.mc-modal-content’).text(modalContent); $ (‘.mc-modal-wrap’).css(‘display’,’flex’); $ (‘.mc-modal’).addClass(modalStatus); //var existsFlag=$ .inArray(‘added’,newappndStr[1]); //$ (‘#toptitleTXT’).html(tickTxt+typevar+’ to your watchlist’); //if(existsFlag == -1) //{ // if(lastRsrs.length > 1) // $ (‘#toptitleTXT’).html(tickTxt+typevar+’already exist in your watchlist’); // else // $ (‘#toptitleTXT’).html(tickTxt+typevar+’already exists in your watchlist’); // //} } //$ (‘.accdiv’).html(”); //$ (‘.accdiv’).html(appndStr); } }, //complete:function(d){ // if(typparam1==1) // { // watchlist_popup(‘open’); // } //} }); }); } else { var disNam =’stock’; if($ (‘#impact_option’).html()==’STOCKS’) disNam =’stock’; if($ (‘#impact_option’).html()==’MUTUAL FUNDS’) disNam =’mutual fund’; if($ (‘#impact_option’).html()==’COMMODITIES’) disNam =’commodity’; alert(‘Please select at least one ‘+disNam); } } else { AFTERLOGINCALLBACK = ‘overlayPopup(‘+e+’, ‘+t+’, ‘+n+’)’; commonPopRHS(); /*work_div = 1; typparam = t; typparam1 = n; check_login_pop(1)*/ } } function pcSavePort(param,call_pg,dispId) { var adtxt=”; if(readCookie(‘nnmc’)){ if(call_pg == “2”) { pass_sec = 2; } else { pass_sec = 1; } var url = ‘//www.moneycontrol.com/mccode/common/saveWatchlist.php’; $ .ajax({url:url, type:”POST”, //data:{q_f:3,wSec:1,dispid:$ (‘input[name=sc_dispid_port]’).val()}, data:{q_f:3,wSec:pass_sec,dispid:dispId}, dataType:”json”, success:function(d) { //var accStr= ”; //$ .each(d.ac,function(i,v) //{ // accStr+=”+v.nm+”; //}); $ .each(d.data,function(i,v) { if(v.flg == ‘0’) { var modalContent = ‘Scheme added to your portfolio.’; var modalStatus = ‘success’; //if error, use ‘error’ $ (‘.mc-modal-content’).text(modalContent); $ (‘.mc-modal-wrap’).css(‘display’,’flex’); $ (‘.mc-modal’).addClass(modalStatus); //$ (‘#acc_sel_port’).html(accStr); //$ (‘#mcpcp_addportfolio .form_field, .form_btn’).removeClass(‘disabled’); //$ (‘#mcpcp_addportfolio .form_field input, .form_field select, .form_btn input’).attr(‘disabled’, false); // //if(call_pg == “2”) //{ // adtxt =’ Scheme added to your portfolio We recommend you add transactional details to evaluate your investment better. x‘; //} //else //{ // adtxt =’ Stock added to your portfolio We recommend you add transactional details to evaluate your investment better. x‘; //} //$ (‘#mcpcp_addprof_info’).css(‘background-color’,’#eeffc8′); //$ (‘#mcpcp_addprof_info’).html(adtxt); //$ (‘#mcpcp_addprof_info’).show(); glbbid=v.id; } }); } }); } else { AFTERLOGINCALLBACK = ‘pcSavePort(‘+param+’, ‘+call_pg+’, ‘+dispId+’)’; commonPopRHS(); /*work_div = 1; typparam = t; typparam1 = n; check_login_pop(1)*/ } } function commonPopRHS(e) { /*var t = ($ (window).height() – $ (“#” + e).height()) / 2 + $ (window).scrollTop(); var n = ($ (window).width() – $ (“#” + e).width()) / 2 + $ (window).scrollLeft(); $ (“#” + e).css({ position: “absolute”, top: t, left: n }); $ (“#lightbox_cb,#” + e).fadeIn(300); $ (“#lightbox_cb”).remove(); $ (“body”).append(”); $ (“#lightbox_cb”).css({ filter: “alpha(opacity=80)” }).fadeIn()*/ $ (“#myframe”).attr(‘src’,’https://accounts.moneycontrol.com/mclogin/?d=2′); $ (“#LoginModal”).modal(); } function overlay(n) { document.getElementById(‘back’).style.width = document.body.clientWidth + “px”; document.getElementById(‘back’).style.height = document.body.clientHeight +”px”; document.getElementById(‘back’).style.display = ‘block’; jQuery.fn.center = function () { this.css(“position”,”absolute”); var topPos = ($ (window).height() – this.height() ) / 2; this.css(“top”, -topPos).show().animate({‘top’:topPos},300); this.css(“left”, ( $ (window).width() – this.width() ) / 2); return this; } setTimeout(function(){$ (‘#backInner’+n).center()},100); } function closeoverlay(n){ document.getElementById(‘back’).style.display = ‘none’; document.getElementById(‘backInner’+n).style.display = ‘none’; } stk_str=”; stk.forEach(function (stkData,index){ if(index==0){ stk_str+=stkData.stockId.trim(); }else{ stk_str+=’,’+stkData.stockId.trim(); } }); $ .get(‘//www.moneycontrol.com/techmvc/mc_apis/stock_details/?sc_id=’+stk_str, function(data) { stk.forEach(function (stkData,index){ $ (‘#stock-name-‘+stkData.stockId.trim()+’-‘+article_id).text(data[stkData.stockId.trim()][‘nse’][‘shortname’]); }); }); function redirectToTradeOpenDematAccountOnline(){ if (stock_isinid && stock_tradeType) { window.open(`https://www.moneycontrol.com/open-demat-account-online?classic=true&script_id=$ {stock_isinid}&ex=$ {stock_tradeType}&site=web&asset_class=stock&utm_source=moneycontrol&utm_medium=articlepage&utm_campaign=tradenow&utm_content=webbutton`, ‘_blank’); } }
After a pull back rally on Friday, Nifty resumed its downward journey on Monday on the back of weakness in auto, banking, FMCG and metal stocks. In last thirteen trading sessions, Nifty fell more than 1,200 points from the high of 18,091 levels, made on September 14.
Short term trend is bearish as Nifty has closed below its 11 and 20 days EMA (exponential moving average). Momentum oscillators like RSI (relative strength index) and MFI (money flow index) are placed below 50 which is far from oversold zone and sloping downwards, indicating room for more downside.
In the derivatives, we have seen aggressive Call writing at 17,000-17,200 levels. Moreover, recent swing high of 17,187 levels coincides with the 11 days EMA which is placed at 17,184 levels. Therefore, unless Nifty closes above 17,200 level, short term trend will remain bearish.
If we were to consider entire upswing from 15,183 (June 17, 2022 Low) to recent swing high of 18,096, 50 percent retracement of up move is placed at 16,640 levels. Moreover, gap created on July 28 suggest support in the vicinity of 16,653-16,746 levels. Therefore, we believe that on the downside, multiple supports are placed in the vicinity of 16,600-16,750 levels. A close below 16,600 level would be considered bearish breakout.
The downside momentum has reversed in NSE Midcap and Smallcap indices last week to form a bullish Hammer pattern around crucial support. Therefore, we believe that there is a higher possibility of Midcap/Smallcap segments to outperform in coming weeks.
Here are three recommendations for the next 3-4 weeks:
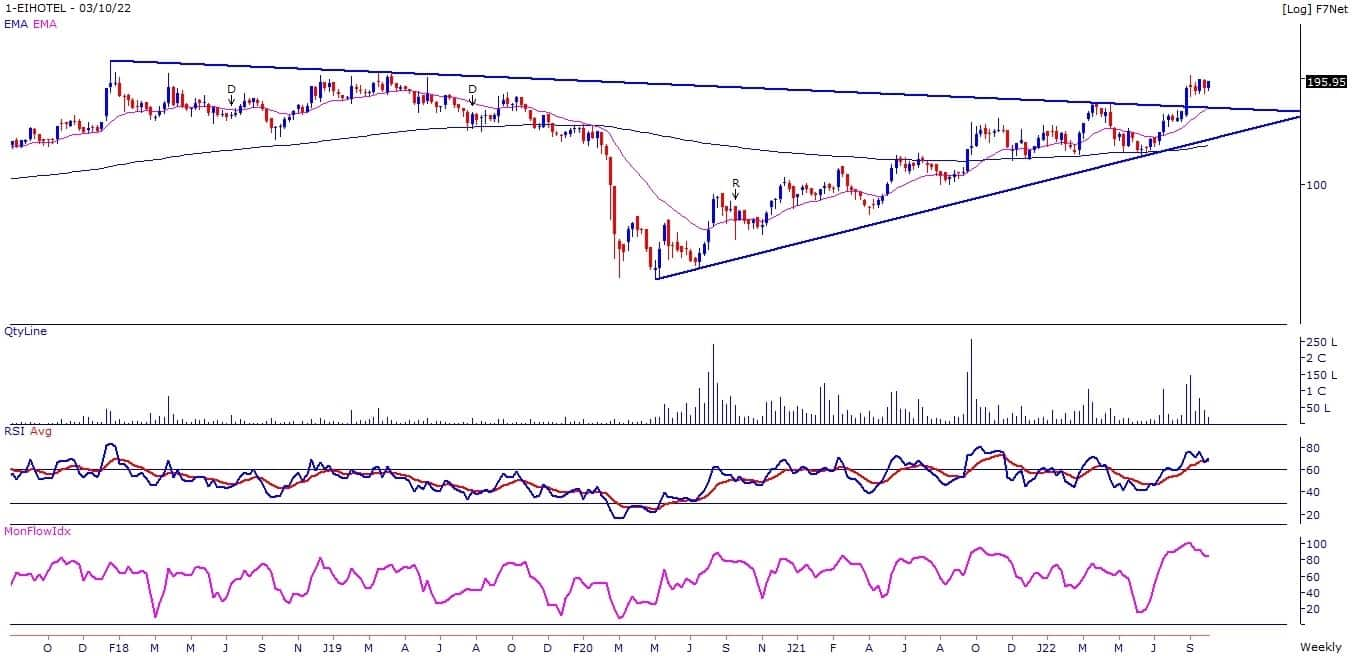
EIH: Buy | LTP: Rs 196 | Stop-Loss: Rs 182 | Target: Rs 212-225 | Return: 15 percent
The stock price has broken out from the symmetrical triangle on the weekly chart with higher volumes. It has broken out on the daily chart on Monday to close at five days high.
Primary trend of the stock is positive as it is trading above its 50, 100 and 200 days EMA. Momentum Oscillators – RSI (11) and MFI (10) have placed above 60 on the weekly chart, indicating strength in the current uptrend of the stock. One can buy the stock in the range of Rs 196-190.
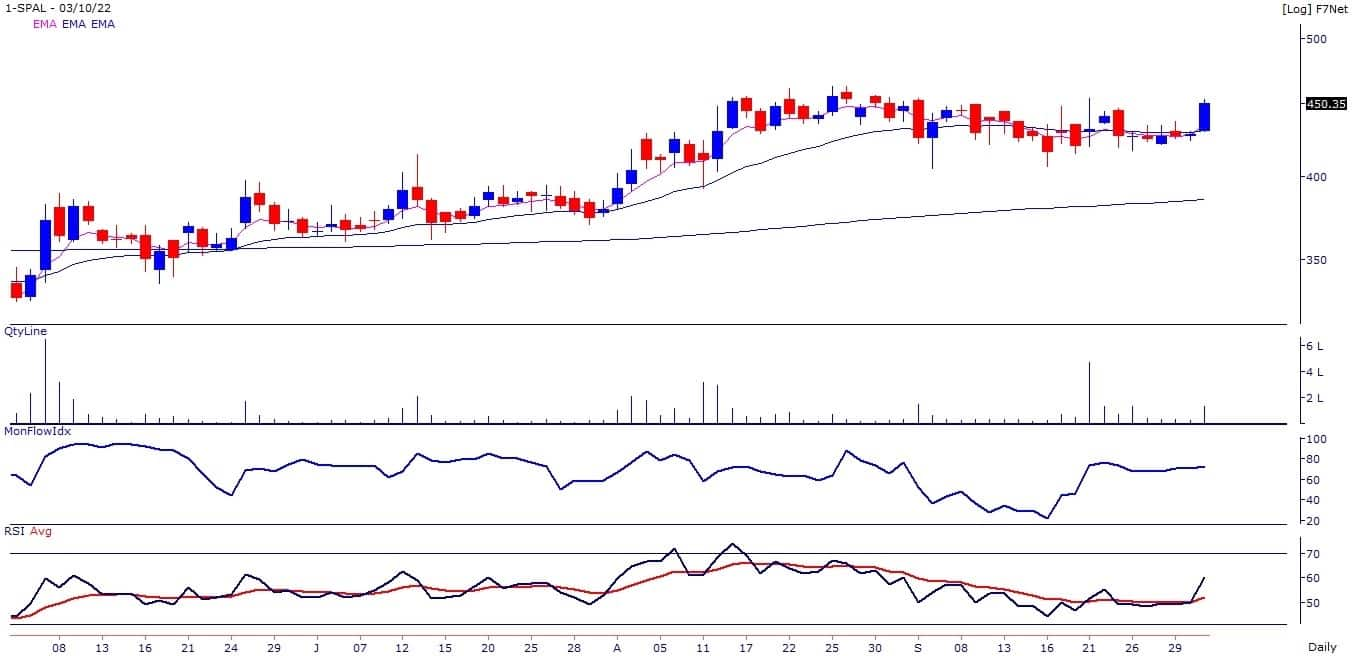
SP Apparels: Buy | LTP: Rs 450 | Stop-Loss: Rs 425 | Target: Rs 485-520 | Return: 16 percent
The stock price has broken out on the daily chart with higher volumes to close at highest level since August 26, 2022. Stock price is forming bullish higher top higher bottom candle stick pattern on the weekly chart.
Momentum Oscillators like RSI (11) and MFI (10) are placed above 60 and sloping upwards on the daily chart, indicating strength in the current uptrend of the stock. One can buy the stock in the range of Rs 440-450.
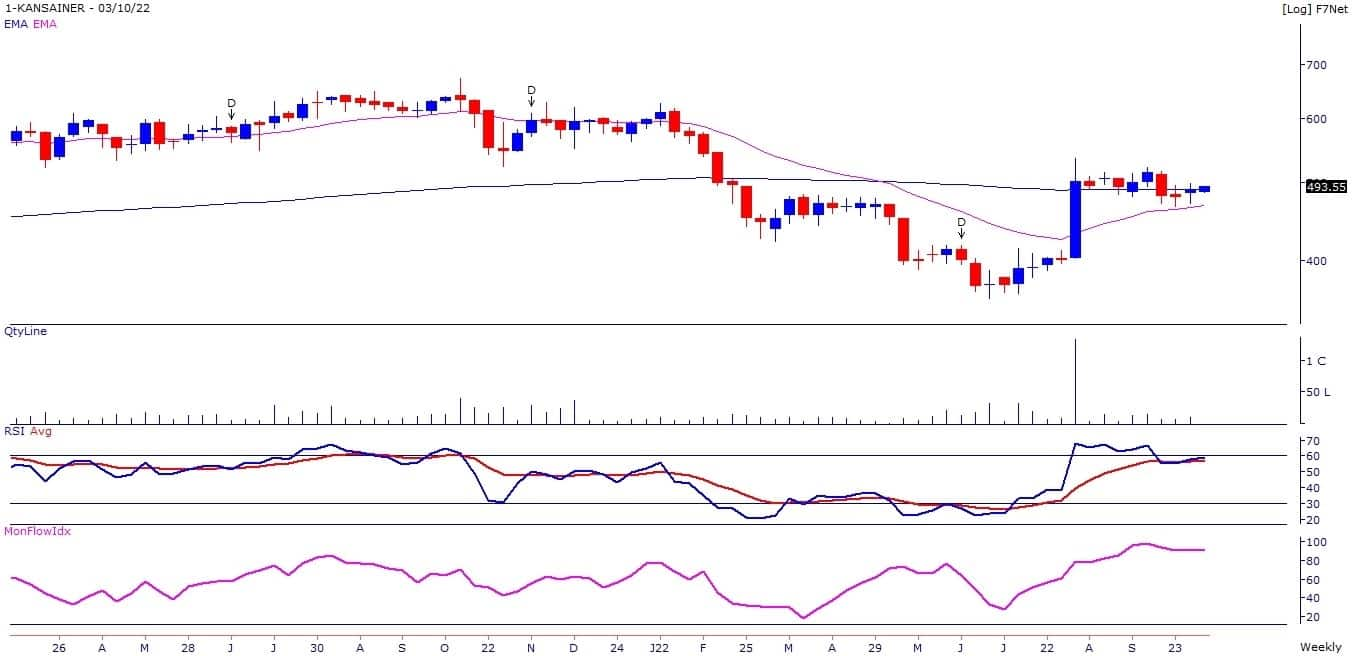
Kansai Nerolac Paints: Buy | LTP: Rs 494 | Stop-Loss: Rs 465 | Target: Rs 530-560 | Return: 13 percent
After broken out on the weekly chart, the stock price is consolidating in the narrow range since last eight weeks. Primary and intermediate trend of the stock is positive as it is trading above its 100 and 200 weeks EMA.
Momentum Oscillators – RSI (11) and MFI (10) have placed above 60 on the daily and weekly chart and sloping upwards, indicating strength in the stock.
Technical indicators are indicating stock price to resume its uptrend in the coming days. One can buy the stock in the range of Rs 485-494.
Disclaimer: The views and investment tips expressed by investment experts on Moneycontrol.com are their own and not those of the website or its management. Moneycontrol.com advises users to check with certified experts before taking any investment decisions.