The Nifty50 is expected to trade within the range of 17,300-17,800 in the short term, and if it decisively gives a close above the upper band of the said range, then there could be a move towards the psychological 18,000 mark, experts said
Sunil Shankar Matkar
September 05, 2022 / 08:06 AM IST

‘); $ (‘#lastUpdated_’+articleId).text(resData[stkKey][‘lastupdate’]); //if(resData[stkKey][‘percentchange’] > 0){ // $ (‘#greentxt_’+articleId).removeClass(“redtxt”).addClass(“greentxt”); // $ (‘.arw_red’).removeClass(“arw_red”).addClass(“arw_green”); //}else if(resData[stkKey][‘percentchange’] < 0){ // $ (‘#greentxt_’+articleId).removeClass(“greentxt”).addClass(“redtxt”); // $ (‘.arw_green’).removeClass(“arw_green”).addClass(“arw_red”); //} if(resData[stkKey][‘percentchange’] >= 0){ $ (‘#greentxt_’+articleId).removeClass(“redtxt”).addClass(“greentxt”); //$ (‘.arw_red’).removeClass(“arw_red”).addClass(“arw_green”); $ (‘#gainlosstxt_’+articleId).find(“.arw_red”).removeClass(“arw_red”).addClass(“arw_green”); }else if(resData[stkKey][‘percentchange’] < 0){ $ (‘#greentxt_’+articleId).removeClass(“greentxt”).addClass(“redtxt”); //$ (‘.arw_green’).removeClass(“arw_green”).addClass(“arw_red”); $ (‘#gainlosstxt_’+articleId).find(‘.arw_green’).removeClass(“arw_green”).addClass(“arw_red”); } $ (‘#volumetxt_’+articleId).show(); $ (‘#vlmtxt_’+articleId).show(); $ (‘#stkvol_’+articleId).text(resData[stkKey][‘volume’]); $ (‘#td-low_’+articleId).text(resData[stkKey][‘daylow’]); $ (‘#td-high_’+articleId).text(resData[stkKey][‘dayhigh’]); $ (‘#rightcol_’+articleId).show(); }else{ $ (‘#volumetxt_’+articleId).hide(); $ (‘#vlmtxt_’+articleId).hide(); $ (‘#stkvol_’+articleId).text(”); $ (‘#td-low_’+articleId).text(”); $ (‘#td-high_’+articleId).text(”); $ (‘#rightcol_’+articleId).hide(); } $ (‘#stk-graph_’+articleId).attr(‘src’,’//appfeeds.moneycontrol.com/jsonapi/stocks/graph&format=json&watch_app=true&range=1d&type=area&ex=’+stockType+’&sc_id=’+stockId+’&width=157&height=100&source=web’); } } } }); } $ (‘.bseliveselectbox’).click(function(){ $ (‘.bselivelist’).show(); }); function bindClicksForDropdown(articleId){ $ (‘ul#stockwidgettabs_’+articleId+’ li’).click(function(){ stkId = jQuery.trim($ (this).find(‘a’).attr(‘stkid’)); $ (‘ul#stockwidgettabs_’+articleId+’ li’).find(‘a’).removeClass(‘active’); $ (this).find(‘a’).addClass(‘active’); stockWidget(‘N’,stkId,articleId); }); $ (‘#stk-b-‘+articleId).click(function(){ stkId = jQuery.trim($ (this).attr(‘stkId’)); stockWidget(‘B’,stkId,articleId); $ (‘.bselivelist’).hide(); }); $ (‘#stk-n-‘+articleId).click(function(){ stkId = jQuery.trim($ (this).attr(‘stkId’)); stockWidget(‘N’,stkId,articleId); $ (‘.bselivelist’).hide(); }); } $ (“.bselivelist”).focusout(function(){ $ (“.bselivelist”).hide(); //hide the results }); function bindMenuClicks(articleId){ $ (‘#watchlist-‘+articleId).click(function(){ var stkId = $ (this).attr(‘stkId’); overlayPopupWatchlist(0,2,1,stkId); }); $ (‘#portfolio-‘+articleId).click(function(){ var dispId = $ (this).attr(‘dispId’); pcSavePort(0,1,dispId); }); } $ (‘.mc-modal-close’).on(‘click’,function(){ $ (‘.mc-modal-wrap’).css(‘display’,’none’); $ (‘.mc-modal’).removeClass(‘success’); $ (‘.mc-modal’).removeClass(‘error’); }); function overlayPopupWatchlist(e, t, n,stkId) { $ (‘.srch_bx’).css(‘z-index’,’999′); typparam1 = n; if(readCookie(‘nnmc’)) { var lastRsrs =new Array(); lastRsrs[e]= stkId; if(lastRsrs.length > 0) { var resStr=”; var url = ‘//www.moneycontrol.com/mccode/common/saveWatchlist.php’; $ .get( “//www.moneycontrol.com/mccode/common/rhsdata.html”, function( data ) { $ (‘#backInner1_rhsPop’).html(data); $ .ajax({url:url, type:”POST”, dataType:”json”, data:{q_f:typparam1,wSec:secglbVar,wArray:lastRsrs}, success:function(d) { if(typparam1==’1′) // rhs { var appndStr=”; var newappndStr = makeMiddleRDivNew(d); appndStr = newappndStr[0]; var titStr=”;var editw=”; var typevar=”; var pparr= new Array(‘Monitoring your investments regularly is important.’,’Add your transaction details to monitor your stock`s performance.’,’You can also track your Transaction History and Capital Gains.’); var phead =’Why add to Portfolio?’; if(secglbVar ==1) { var stkdtxt=’this stock’; var fltxt=’ it ‘; typevar =’Stock ‘; if(lastRsrs.length>1){ stkdtxt=’these stocks’; typevar =’Stocks ‘;fltxt=’ them ‘; } } //var popretStr =lvPOPRHS(phead,pparr); //$ (‘#poprhsAdd’).html(popretStr); //$ (‘.btmbgnwr’).show(); var tickTxt =’‘; if(typparam1==1) { var modalContent = ‘Watchlist has been updated successfully.’; var modalStatus = ‘success’; //if error, use ‘error’ $ (‘.mc-modal-content’).text(modalContent); $ (‘.mc-modal-wrap’).css(‘display’,’flex’); $ (‘.mc-modal’).addClass(modalStatus); //var existsFlag=$ .inArray(‘added’,newappndStr[1]); //$ (‘#toptitleTXT’).html(tickTxt+typevar+’ to your watchlist’); //if(existsFlag == -1) //{ // if(lastRsrs.length > 1) // $ (‘#toptitleTXT’).html(tickTxt+typevar+’already exist in your watchlist’); // else // $ (‘#toptitleTXT’).html(tickTxt+typevar+’already exists in your watchlist’); // //} } //$ (‘.accdiv’).html(”); //$ (‘.accdiv’).html(appndStr); } }, //complete:function(d){ // if(typparam1==1) // { // watchlist_popup(‘open’); // } //} }); }); } else { var disNam =’stock’; if($ (‘#impact_option’).html()==’STOCKS’) disNam =’stock’; if($ (‘#impact_option’).html()==’MUTUAL FUNDS’) disNam =’mutual fund’; if($ (‘#impact_option’).html()==’COMMODITIES’) disNam =’commodity’; alert(‘Please select at least one ‘+disNam); } } else { AFTERLOGINCALLBACK = ‘overlayPopup(‘+e+’, ‘+t+’, ‘+n+’)’; commonPopRHS(); /*work_div = 1; typparam = t; typparam1 = n; check_login_pop(1)*/ } } function pcSavePort(param,call_pg,dispId) { var adtxt=”; if(readCookie(‘nnmc’)){ if(call_pg == “2”) { pass_sec = 2; } else { pass_sec = 1; } var url = ‘//www.moneycontrol.com/mccode/common/saveWatchlist.php’; $ .ajax({url:url, type:”POST”, //data:{q_f:3,wSec:1,dispid:$ (‘input[name=sc_dispid_port]’).val()}, data:{q_f:3,wSec:pass_sec,dispid:dispId}, dataType:”json”, success:function(d) { //var accStr= ”; //$ .each(d.ac,function(i,v) //{ // accStr+=”+v.nm+”; //}); $ .each(d.data,function(i,v) { if(v.flg == ‘0’) { var modalContent = ‘Scheme added to your portfolio.’; var modalStatus = ‘success’; //if error, use ‘error’ $ (‘.mc-modal-content’).text(modalContent); $ (‘.mc-modal-wrap’).css(‘display’,’flex’); $ (‘.mc-modal’).addClass(modalStatus); //$ (‘#acc_sel_port’).html(accStr); //$ (‘#mcpcp_addportfolio .form_field, .form_btn’).removeClass(‘disabled’); //$ (‘#mcpcp_addportfolio .form_field input, .form_field select, .form_btn input’).attr(‘disabled’, false); // //if(call_pg == “2”) //{ // adtxt =’ Scheme added to your portfolio We recommend you add transactional details to evaluate your investment better. x‘; //} //else //{ // adtxt =’ Stock added to your portfolio We recommend you add transactional details to evaluate your investment better. x‘; //} //$ (‘#mcpcp_addprof_info’).css(‘background-color’,’#eeffc8′); //$ (‘#mcpcp_addprof_info’).html(adtxt); //$ (‘#mcpcp_addprof_info’).show(); glbbid=v.id; } }); } }); } else { AFTERLOGINCALLBACK = ‘pcSavePort(‘+param+’, ‘+call_pg+’, ‘+dispId+’)’; commonPopRHS(); /*work_div = 1; typparam = t; typparam1 = n; check_login_pop(1)*/ } } function commonPopRHS(e) { /*var t = ($ (window).height() – $ (“#” + e).height()) / 2 + $ (window).scrollTop(); var n = ($ (window).width() – $ (“#” + e).width()) / 2 + $ (window).scrollLeft(); $ (“#” + e).css({ position: “absolute”, top: t, left: n }); $ (“#lightbox_cb,#” + e).fadeIn(300); $ (“#lightbox_cb”).remove(); $ (“body”).append(”); $ (“#lightbox_cb”).css({ filter: “alpha(opacity=80)” }).fadeIn()*/ $ (“#myframe”).attr(‘src’,’https://accounts.moneycontrol.com/mclogin/?d=2′); $ (“#LoginModal”).modal(); } function overlay(n) { document.getElementById(‘back’).style.width = document.body.clientWidth + “px”; document.getElementById(‘back’).style.height = document.body.clientHeight +”px”; document.getElementById(‘back’).style.display = ‘block’; jQuery.fn.center = function () { this.css(“position”,”absolute”); var topPos = ($ (window).height() – this.height() ) / 2; this.css(“top”, -topPos).show().animate({‘top’:topPos},300); this.css(“left”, ( $ (window).width() – this.width() ) / 2); return this; } setTimeout(function(){$ (‘#backInner’+n).center()},100); } function closeoverlay(n){ document.getElementById(‘back’).style.display = ‘none’; document.getElementById(‘backInner’+n).style.display = ‘none’; } stk_str=”; stk.forEach(function (stkData,index){ if(index==0){ stk_str+=stkData.stockId.trim(); }else{ stk_str+=’,’+stkData.stockId.trim(); } }); $ .get(‘//www.moneycontrol.com/techmvc/mc_apis/stock_details/?sc_id=’+stk_str, function(data) { stk.forEach(function (stkData,index){ $ (‘#stock-name-‘+stkData.stockId.trim()+’-‘+article_id).text(data[stkData.stockId.trim()][‘nse’][‘shortname’]); }); }); function redirectToTradeOpenDematAccountOnline(){ if (stock_isinid && stock_tradeType) { window.open(`https://www.moneycontrol.com/open-demat-account-online?classic=true&script_id=$ {stock_isinid}&ex=$ {stock_tradeType}&site=web&asset_class=stock&utm_source=moneycontrol&utm_medium=articlepage&utm_campaign=tradenow&utm_content=webbutton`, ‘_blank’); } }
The market consolidated further and ended the volatile session almost flat with negative bias in the week ended September 2 as the big loss seen in the first session was recovered in the following sessions and the Nifty50 respected not only 17,166, the weekly low, but also 17,300, the near-term crucial support. On the other side, the weekly high near 17,800 is going to be a crucial hurdle in the coming sessions.
Hence, the index is expected to trade within the range of 17,300-17,800 in short term, and if it decisively gives a close above the upper band of the said range, then there could be a move towards the psychological 18,000 mark, experts said.
The BSE Sensex closed at 58,803 and the Nifty50 at 17,540, down 0.1 percent each, on a week-on-week basis. However, the broader markets outperformed the frontliners as the Nifty Midcap 100 index gained nearly 1 percent and Smallcap 100 index rose 0.2 percent.
Nifty50 on the weekly chart formed a long bull candle with an upper shadow as the closing was higher than the opening levels.
“This pattern signals an emergence of a sustainable upside from the lows of 17,170. After reacting down from the important resistance of down trend line (connected from lower tops) at 17,900 levels in mid of August, the market has not showed any sharp down trended movement so far. The buying has emerged from the immediate supports,” Nagaraj Shetti, Technical Research Analyst at HDFC Securities said.
The market expert expects the short term trend of Nifty to remain choppy. The market is now placed with in a broader high low range of 17,800-17,300 levels and the movement within this range is likely to continue for next week, he feels.
One may expect selling pressure building from the highs around 17,800 levels and the buying is likely to emerge from the lows of 17,300 levels. Hence, the market action could be a buy on dips and sell on rise opportunity for near term, he advised.
Let’s take a look at the top 10 trading ideas by experts for the next three-four weeks. Returns are based on the September 2 closing prices:
Shrikant Chouhan, Head of Equity Research (Retail) at Kotak Securities
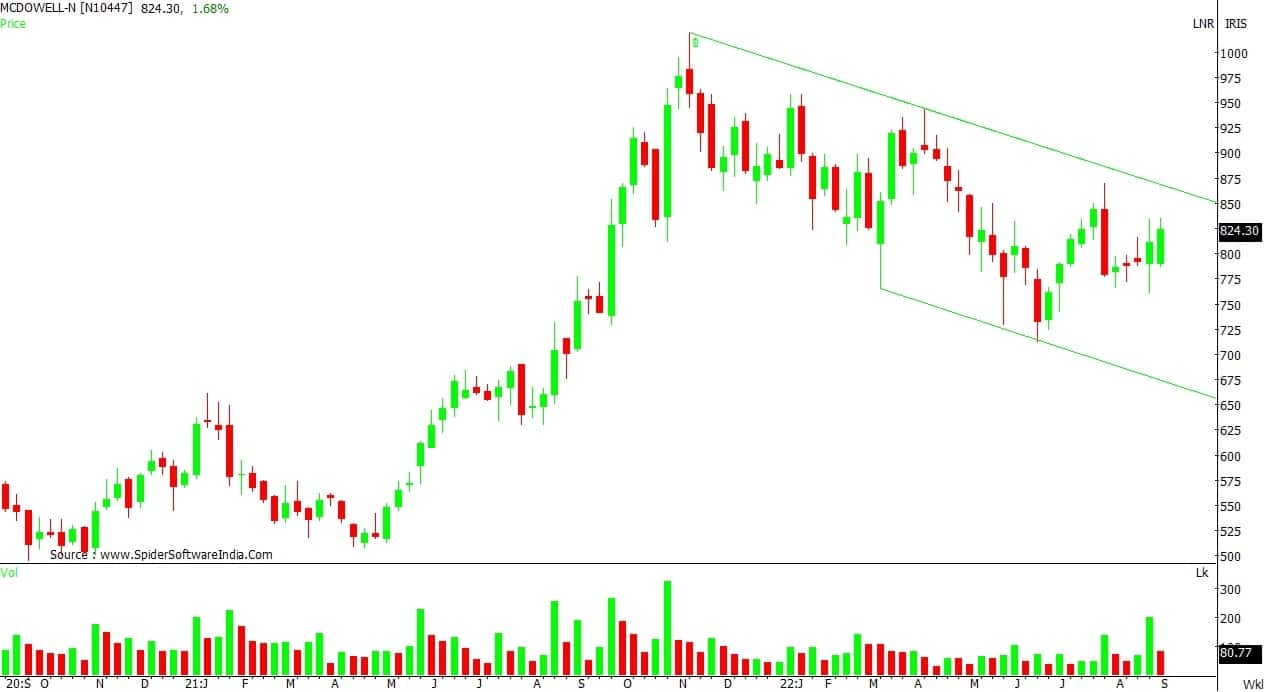
United Spirits: Buy | LTP: Rs 824.3 | Stop-Loss: Rs 790 | Target: Rs 880-900 | Return: 7-9 percent
The stock had completed its corrective pattern in the month of June 2022 at Rs 712. It was correcting the surprising move, which started at Rs 500 in April 2021 and ended at Rs 1,020 in November 2021.
For the past two months, the stock has been making higher bottoms between Rs 750 and Rs 800, indicating buying interest between specific levels.
Over the past week, it seems that the stock has completed the last phase of correction and is ready to hit the first set of resistance, which is between Rs 880 to Rs 900. It is a good risk-to-reward ratio if we buy at current levels. Place stop-loss at Rs 790.
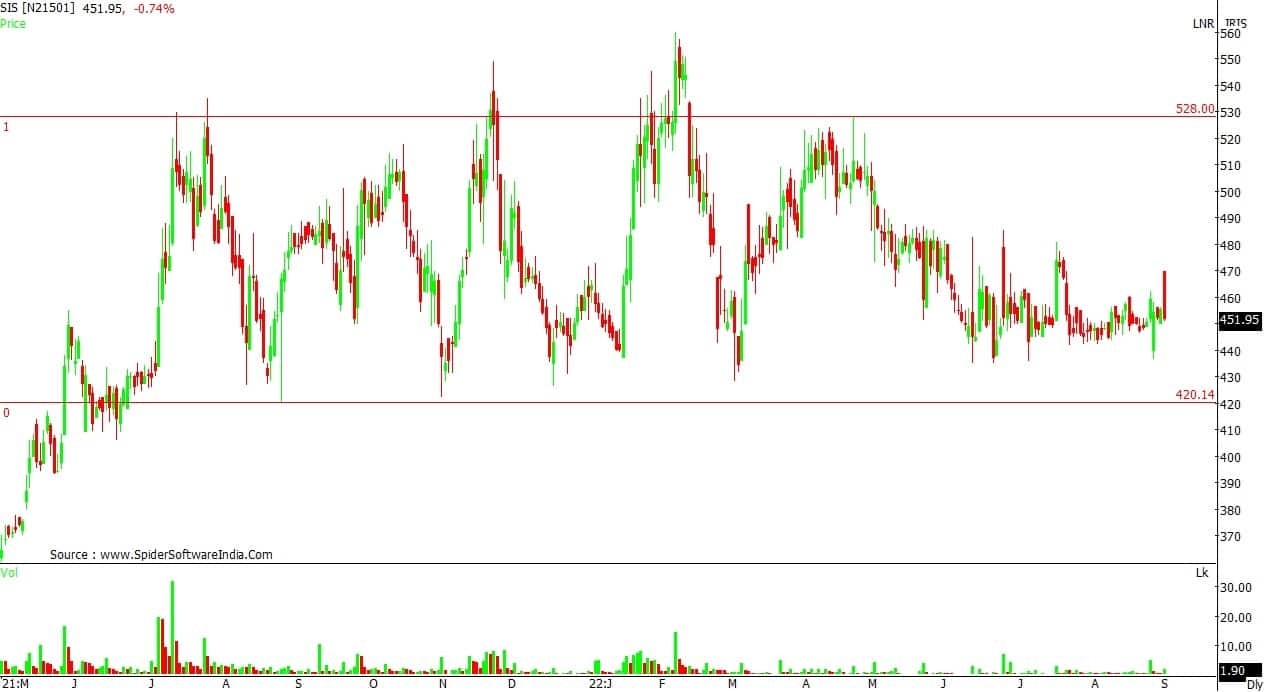
SIS: Buy | LTP: Rs 452 | Stop-Loss: Rs 430 | Target: Rs 480-550 | Return: 6-22 percent
Technically, since July 2021, the stock is forming a “rectangular consolidation” between Rs 430 and Rs 550 levels. After hitting the lower bound in the month of June 2022, it is bouncing back with an increase in volume.
It is available with a great risk-to-reward ratio. Buy at current levels and place stop-loss at Rs 430 on a closing basis. Resistance will be at Rs 480 and Rs 550.
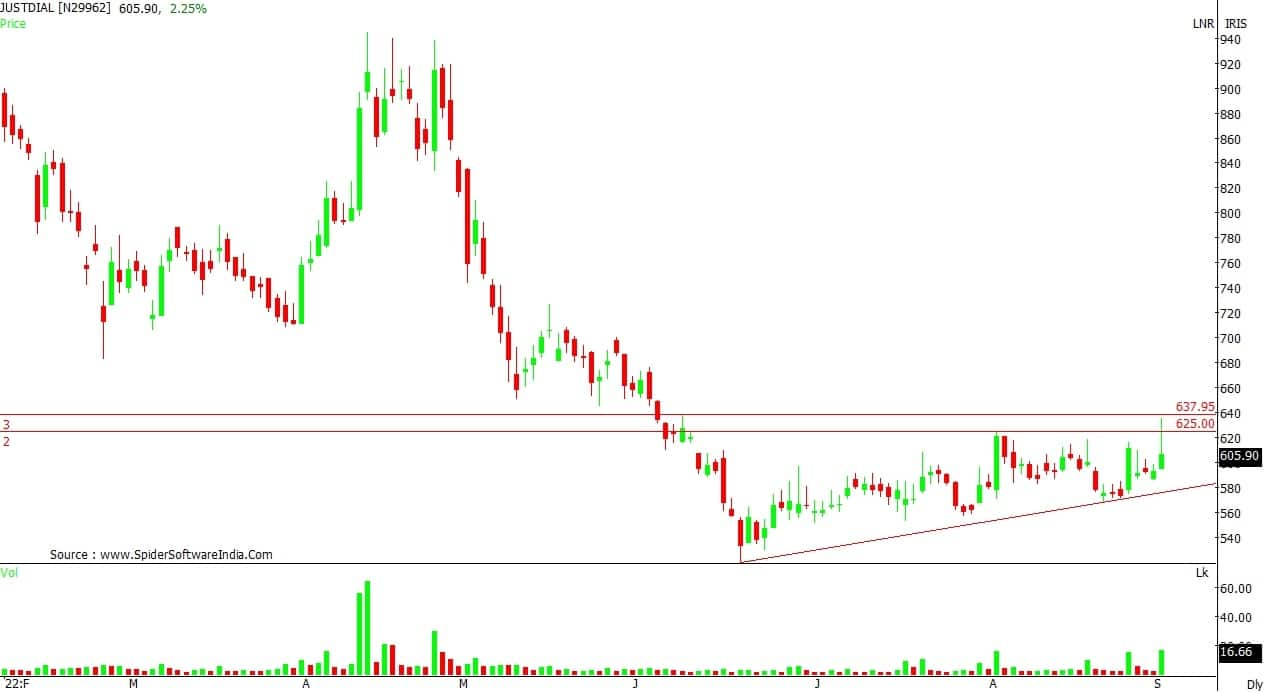
Just Dial: Buy | LTP: Rs 606 | Stop-Loss: Rs 560 | Target: Rs 700-750 | Return: 15-24 percent
The stock is forming an ascending triangle at the bottom of the recent selloff. It is an indication that buyers are taking interest in the stock every fall and sellers are not in a hurry to sell the stock. They are selling at specific levels either at Rs 620 or Rs 638.
We have seen in the past that such type of formation eventually ends with an upward break out as an aggressive buyer absorbs selling pressure, which is at a specific level.
One can accumulate between Rs 610 and Rs 580 from a positional standpoint, with a stop-loss at Rs 560 and price target of Rs 700 and Rs 750.
Nagaraj Shetti, Technical Research Analyst at HDFC Securities
Endurance Technologies: Buy | LTP: Rs 1,518.65 | Stop-Loss: Rs 1,420 | Target: Rs 1,650-1,800 | Return: 9-18 percent
The attached weekly timeframe chart of Endurance Technologies indicates a larger consolidation pattern over the last 5-6 weeks. The stock price has witnessed a sharp upside breakout of this consolidation at Rs 1,470 levels last week and is now showing minor consolidation at the highs.
The present action in the stock price signal a Bullish Flag Breakout at Rs 1,470, which is bullish continuation pattern.
Weekly 14 period RSI (relative strength index) has placed at the edge of moving above upper 60 levels and volume has started to expand gradually during upside breakout in the stock price. This is positive indication and one may expect more upmove ahead.
One can initiate buying in Endurance at current market price (Rs 1,518.65), add more on dips down to Rs 1,465 and wait for the upside targets of Rs 1,650-1800 in the next 3-5 weeks, with a stop-loss of Rs 1,420.

Welspun Corp: Buy | LTP: Rs 241.3 | Stop-Loss: Rs 225 | Target: Rs 259-285 | Return: 7-18 percent
After showing a larger range movement in the last few months, the stock price is in the process of upside breakout of the range at Rs 240 levels. The weekly candle pattern indicates that the upside momentum could continue for the short term.
The larger positive sequence like higher tops and bottoms is intact as per weekly timeframe chart. Volume has expanded on Friday during upside breakout and the weekly 14 period RSI shows positive indication.
One may look to buy Welspun Corp at CMP (Rs 241.3), add more on dips down to Rs 232 and wait for the upside targets of Rs 259-285 in the next 3-5 weeks. Place a stop-loss of Rs 225.

GE Power India: Buy | LTP: Rs 152 | Stop-Loss: Rs 140 | Target: Rs 165-180 | Return: 8-18 percent
The down trend of the last many months seems to have completed in this stock. The stock price is in an attempt to stage decisive upside reversal of down trend (type of triangle pattern) at Rs 153 levels.
After showing a larger downward trend in the last many months, the stock price seems to have halted its down trend and recently showed an accumulation type pattern at the lows. This bullish action could indicate sustainable change in trend in the stock price towards upside.
The volume has started to expand gradually and weekly 14 period RSI and weekly ADX/DMI (average directional index/directional movement index) signal chances of further strengthening of upside momentum for the stock price ahead.
One may look to buy GEPIL at CMP (Rs 152), add more on dips down to Rs 145 and wait for the upside targets of Rs 165-180 in the next 3-5 weeks. Place a stop-loss of Rs 140.

Ruchit Jain, Lead Research at 5paisa
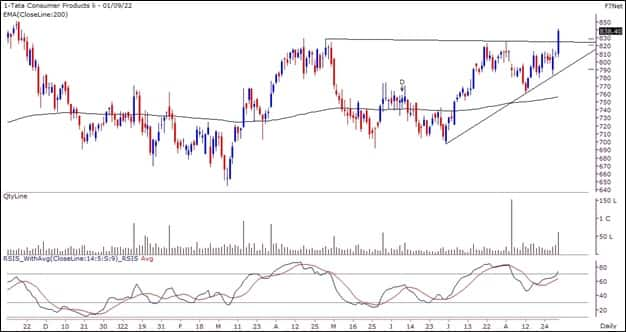
Tata Consumer Products: Buy | LTP: Rs 833.7 | Stop-Loss: Rs 800 | Target: Rs 880-905 | Return: 5-8 percent
The stock had recently seen a consolidation which has led to formation of an ‘Ascending Triangle’ pattern on the daily chart. The prices have now given a breakout from the pattern with good volumes. The ‘RSI Smoothed’ oscillator has also given a positive crossover and is indicating a positive momentum. Hence, we expect further upmove in the stock in the short term.
So traders can look to buy the stock around Rs 838 and look to add on dips towards Rs 826 for potential short term targets of Rs 880 and Rs 905. The stop-loss on long positions should be placed below the support of Rs 800.
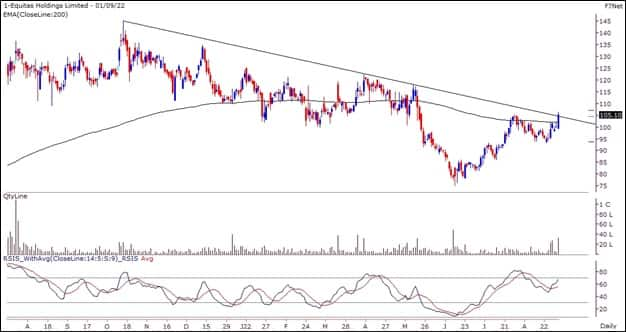
Equitas Holdings: Buy | LTP: Rs 102.15 | Stop-Loss: Rs 98 | Target: Rs 112-118 | Return: 10-15 percent
After a decent upmove, the stock went through a corrective phase along with the broader markets since the month of October 2021. However, the stock has recovered from the lows in the last couple of months and has now given a breakout above its falling trendline resistance.
Prices have also surpassed the ‘200 DEMA’ (days exponential moving average) hurdle and closed above the same. The volumes are increasing gradually while the momentum setups are indicating a positive structure.
Hence, traders can look to buy the stock in the range of Rs 105-102 for potential short term targets of Rs 112 and Rs 118. The stop-loss on long positions should be placed below the support of Rs 98.
Jigar S Patel, Senior Manager – Equity Research at Anand Rathi Shares & Stock Brokers
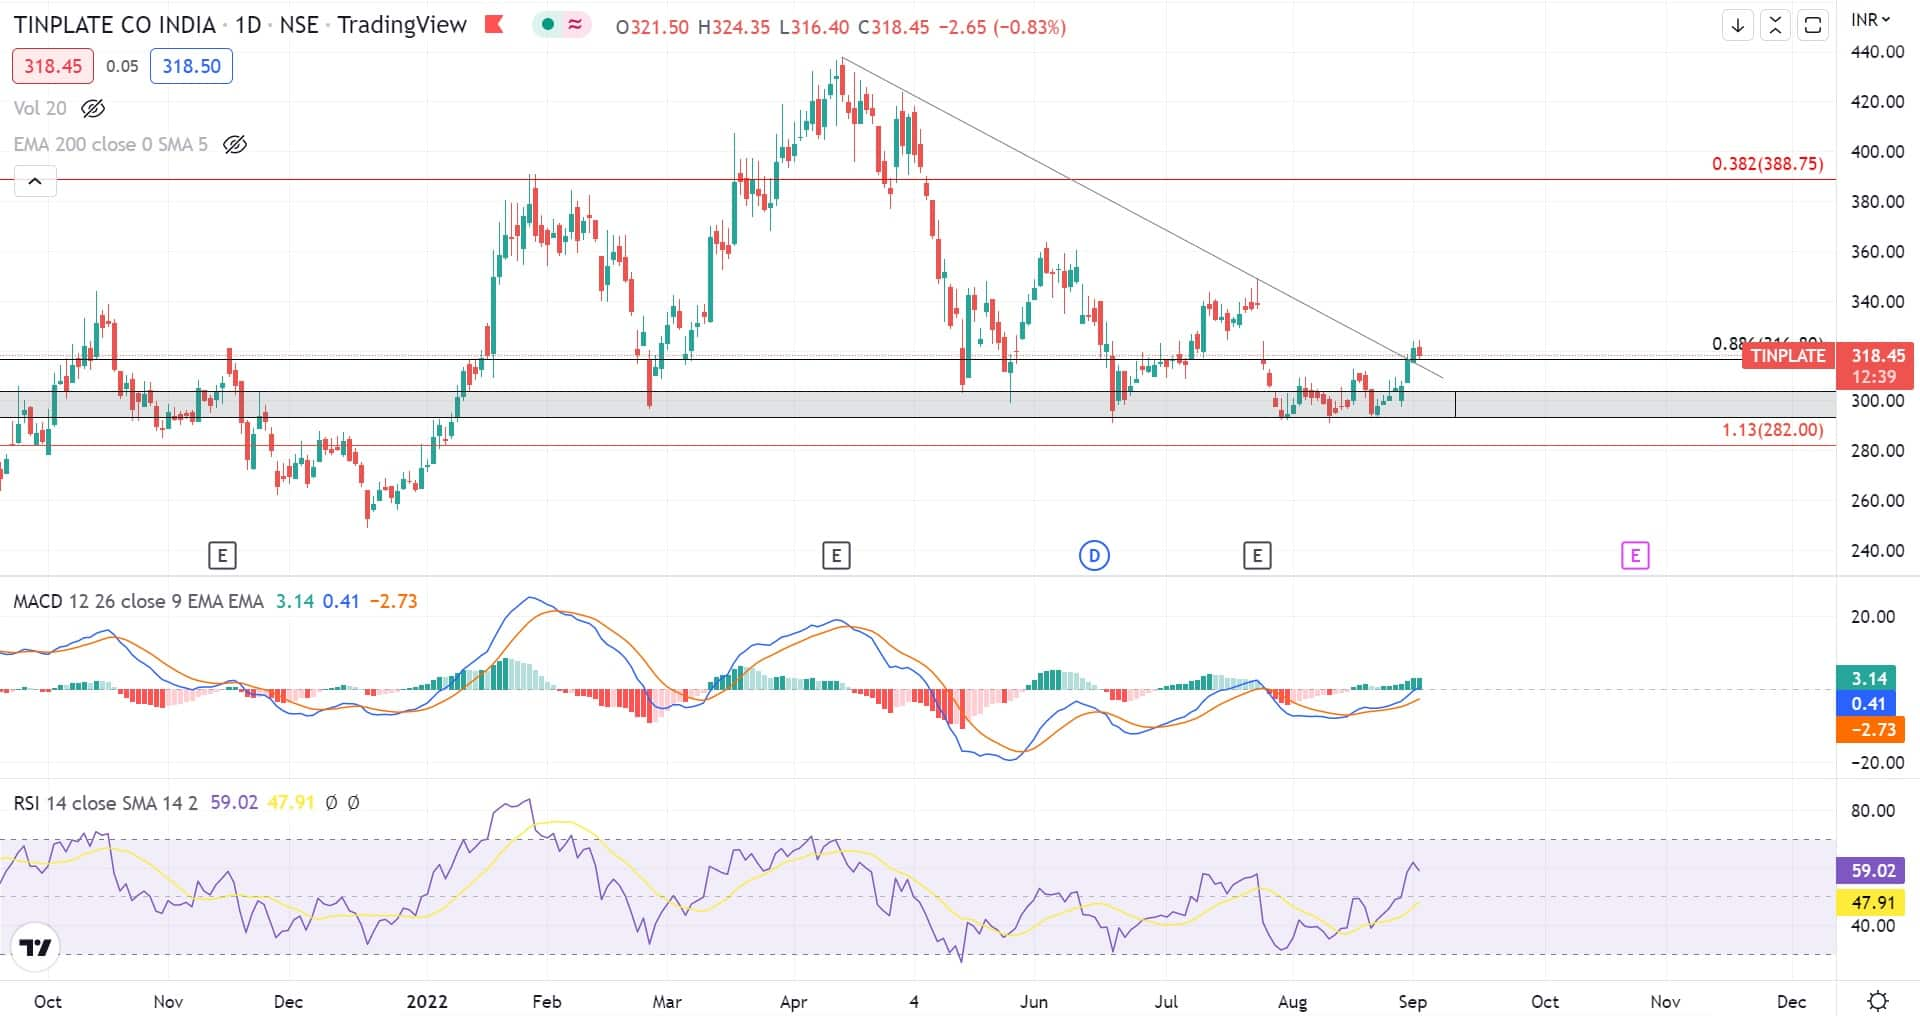
Tinplate Company of India: Buy | LTP: Rs 318 | Stop-Loss: Rs 285 | Target: Rs 375 | Return: 18 percent
Tinplate Company has corrected almost 34 percent from its top of Rs 438 which was registered on April 13, 2022. On weekly scale, it has taken support near its previous historical support zone Rs 290-300.
Since last one month it has made nice base near Rs 300 levels. Recently on daily scale, the stock confirmed a Bullish Inverted Hammer candlestick pattern exactly at the mentioned historical support and that is adding more confirmation of further upside in the counter.
In addition to the above discussed technical reasoning, weekly RSI has nicely bounced back from 40 levels which is adding more strength in the said counter. Thus we advise traders to buy the stock for an upside target of Rs 375 with a stop-loss of Rs 285.
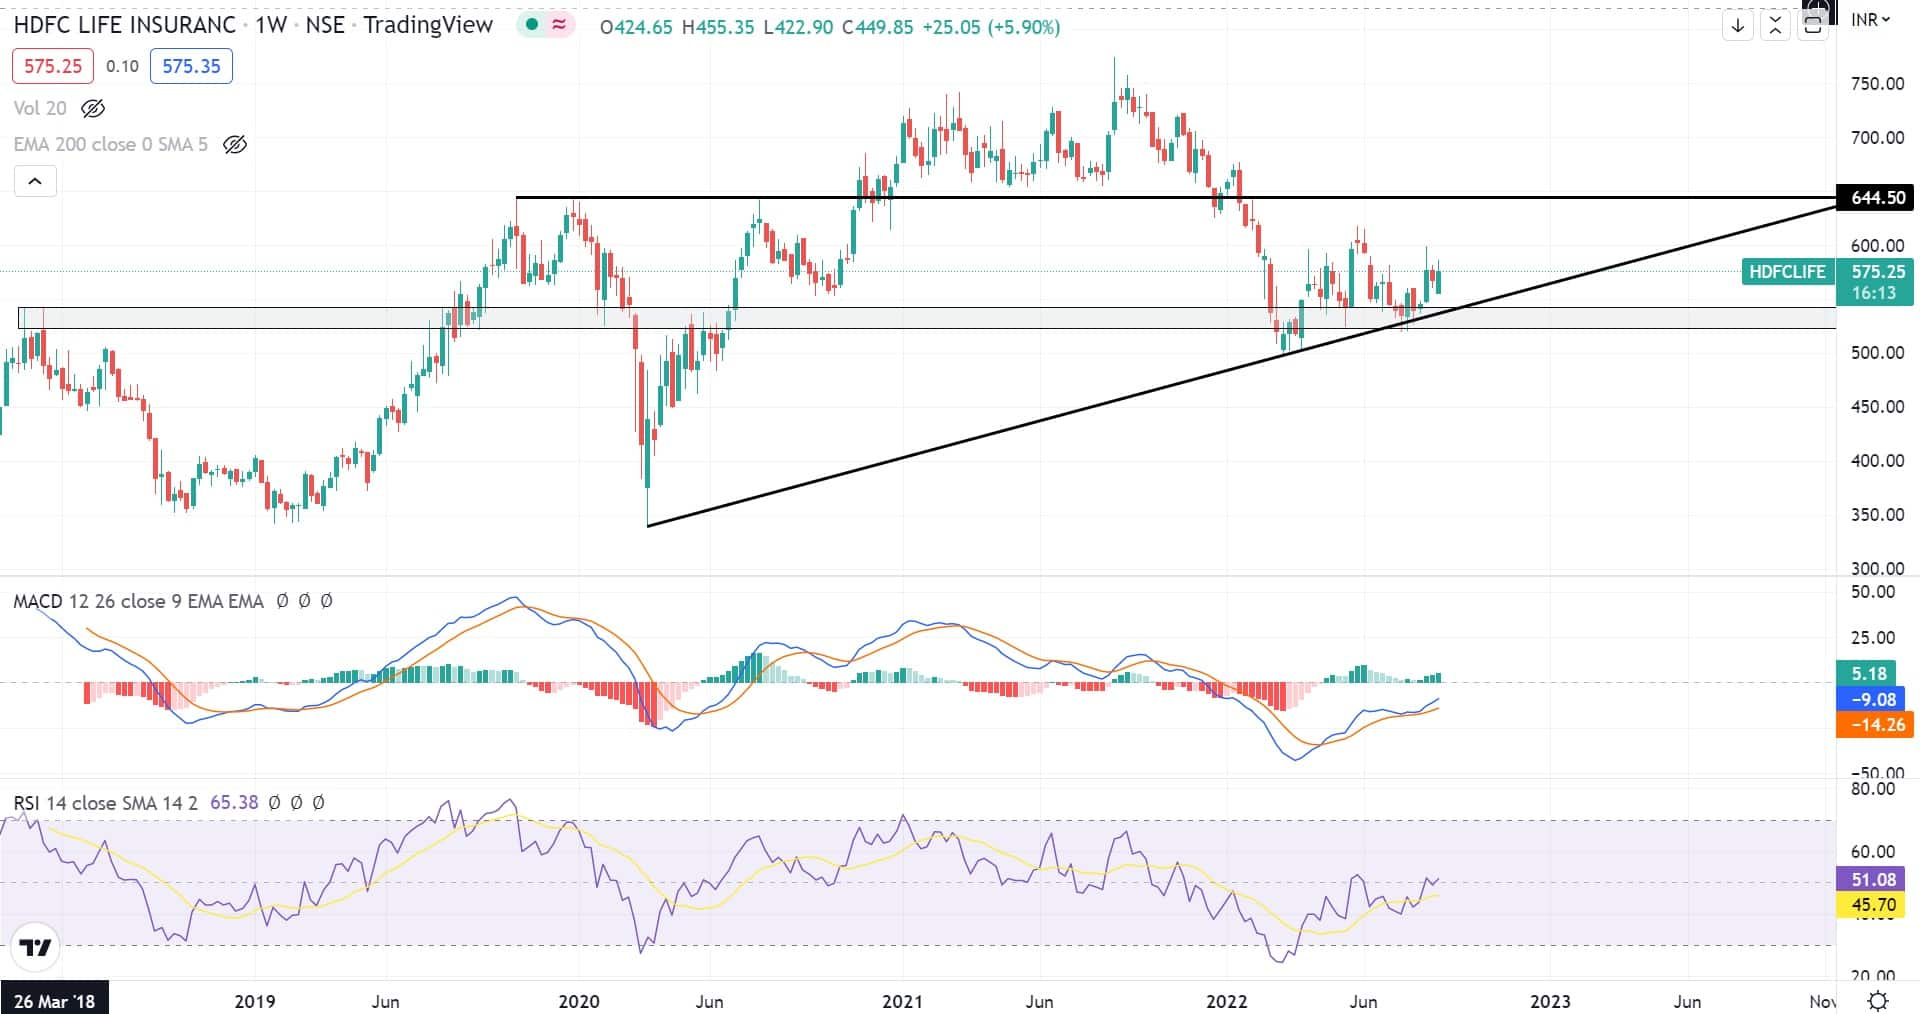
HDFC Life Insurance Company: Buy | LTP: Rs 575 | Stop-Loss: Rs 538 | Target: Rs 650 | Return: 13 percent
The stock has corrected almost 35 percent from its top of Rs 774 which was made on August 30, 2021. From March 2 till August 12, it has been hovering near the crucial support zone of Rs 520-550.
Recently on weekly scale the stock made Bullish Harami candlestick pattern along with volume picking up exactly near said support zone which is a possible sign of early reversal.
Thus we advise traders to buy the stock for an upside target of Rs 650 with a stop-loss of Rs 538.
Disclaimer: The views and investment tips expressed by investment experts on Moneycontrol.com are their own and not those of the website or its management. Moneycontrol.com advises users to check with certified experts before taking any investment decisions.

