Anxious bulls are waiting in vain if they are waiting for the U.S. stock market to break above its 200-day moving average. I say that not because I somehow know that the market will fail to close above its average level of the past 200 days. My point is that, even if it does, it will carry no particular bullish significance.
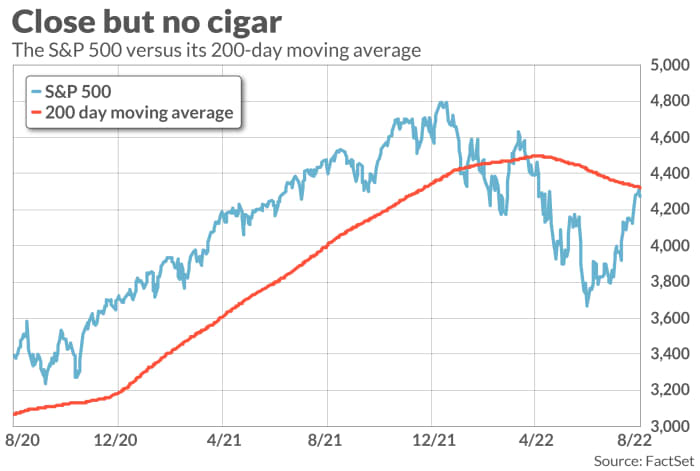
The significance of the 200-day moving average is on stock traders’ mind this week because the market’s powerful rally over the past two months has brought it to within shouting distance of that average. On Tuesday of this week, the S&P 500’s SPX, +0.33% intraday high was just 0.02% below this threshold. During Thursday’s trading, the index was hovering about one percent below its 200-day moving average, according to FactSet data.
To determine whether closing above the 200-day moving average carries any significance, I analyzed the S&P 500 (or its predecessor index) back to the mid-1920s. I focused in particular on all days on which the index first closed above its 200-day moving average. The table below summarizes what I found.
| Subsequent month | Subsequent quarter | Subsequent 6 months | Subsequent 12 months | |
| 200-day moving average buy signals | 0.9% | 1.2% | 2.9% | 6.0% |
| All other days | 0.6% | 1.8% | 3.6% | 7.4% |
As you can see, over the subsequent month the market has done slightly better following 200-day moving average buy signals. While this is consistent with the bullish interpretation that Wall Street puts on closing above the 200-day moving average, notice the data in the other three columns: Over the subsequent quarter, six months and 12 months, the market does slightly worse following such signals, on average. That’s directly contrary to the bullish interpretation.
Before you rush to become a contrarian about the 200-day moving average, you should know that none of the differences reported in this chart is significant at the 95% confidence level that statisticians often use when determining if a pattern is genuine. So neither the bullish nor the bearish interpretation is supported by the data.
It still could be that the 200-day moving average is helpful to traders, if used in conjunction with other indicators. It might be, for example, that a 200-day moving average buy signal means one thing when the market is undervalued or when interest rates are declining, and another when the market is overvalued or rates are rising.
I’m skeptical. Though I couldn’t analyze every possible combination of the 200-day moving average with other indicators, the ones I tested showed that whatever predictive value the indicator combination had was due to those other indicators and not to the 200-day moving average.
The bottom line? How the stock market performs from here will have nothing to do with where it stands relative to its 200-day moving average.
Mark Hulbert is a regular contributor to MarketWatch. His Hulbert Ratings tracks investment newsletters that pay a flat fee to be audited. He can be reached at mark@hulbertratings.com
Don’t miss: Hear from Carl Icahn at the Best New Ideas in Money Festival on Sept. 21 and Sept. 22 in New York. The legendary trader will reveal his view on this year’s wild market ride.