Hikal share price clocked 9.2 percent gains at Rs 322.35, continuing uptrend for fourth straight day, and formed strong bullish candlestick pattern on the daily charts for second consecutive session. In fact, it has broken long down sloping resistance trend line adjoining September 16, 2021 and May 6, 2022.
Sunil Shankar Matkar
August 18, 2022 / 08:31 AM IST

‘); $ (‘#lastUpdated_’+articleId).text(resData[stkKey][‘lastupdate’]); //if(resData[stkKey][‘percentchange’] > 0){ // $ (‘#greentxt_’+articleId).removeClass(“redtxt”).addClass(“greentxt”); // $ (‘.arw_red’).removeClass(“arw_red”).addClass(“arw_green”); //}else if(resData[stkKey][‘percentchange’] < 0){ // $ (‘#greentxt_’+articleId).removeClass(“greentxt”).addClass(“redtxt”); // $ (‘.arw_green’).removeClass(“arw_green”).addClass(“arw_red”); //} if(resData[stkKey][‘percentchange’] >= 0){ $ (‘#greentxt_’+articleId).removeClass(“redtxt”).addClass(“greentxt”); //$ (‘.arw_red’).removeClass(“arw_red”).addClass(“arw_green”); $ (‘#gainlosstxt_’+articleId).find(“.arw_red”).removeClass(“arw_red”).addClass(“arw_green”); }else if(resData[stkKey][‘percentchange’] < 0){ $ (‘#greentxt_’+articleId).removeClass(“greentxt”).addClass(“redtxt”); //$ (‘.arw_green’).removeClass(“arw_green”).addClass(“arw_red”); $ (‘#gainlosstxt_’+articleId).find(‘.arw_green’).removeClass(“arw_green”).addClass(“arw_red”); } $ (‘#volumetxt_’+articleId).show(); $ (‘#vlmtxt_’+articleId).show(); $ (‘#stkvol_’+articleId).text(resData[stkKey][‘volume’]); $ (‘#td-low_’+articleId).text(resData[stkKey][‘daylow’]); $ (‘#td-high_’+articleId).text(resData[stkKey][‘dayhigh’]); $ (‘#rightcol_’+articleId).show(); }else{ $ (‘#volumetxt_’+articleId).hide(); $ (‘#vlmtxt_’+articleId).hide(); $ (‘#stkvol_’+articleId).text(”); $ (‘#td-low_’+articleId).text(”); $ (‘#td-high_’+articleId).text(”); $ (‘#rightcol_’+articleId).hide(); } $ (‘#stk-graph_’+articleId).attr(‘src’,’//appfeeds.moneycontrol.com/jsonapi/stocks/graph&format=json&watch_app=true&range=1d&type=area&ex=’+stockType+’&sc_id=’+stockId+’&width=157&height=100&source=web’); } } } }); } $ (‘.bseliveselectbox’).click(function(){ $ (‘.bselivelist’).show(); }); function bindClicksForDropdown(articleId){ $ (‘ul#stockwidgettabs_’+articleId+’ li’).click(function(){ stkId = jQuery.trim($ (this).find(‘a’).attr(‘stkid’)); $ (‘ul#stockwidgettabs_’+articleId+’ li’).find(‘a’).removeClass(‘active’); $ (this).find(‘a’).addClass(‘active’); stockWidget(‘N’,stkId,articleId); }); $ (‘#stk-b-‘+articleId).click(function(){ stkId = jQuery.trim($ (this).attr(‘stkId’)); stockWidget(‘B’,stkId,articleId); $ (‘.bselivelist’).hide(); }); $ (‘#stk-n-‘+articleId).click(function(){ stkId = jQuery.trim($ (this).attr(‘stkId’)); stockWidget(‘N’,stkId,articleId); $ (‘.bselivelist’).hide(); }); } $ (“.bselivelist”).focusout(function(){ $ (“.bselivelist”).hide(); //hide the results }); function bindMenuClicks(articleId){ $ (‘#watchlist-‘+articleId).click(function(){ var stkId = $ (this).attr(‘stkId’); overlayPopupWatchlist(0,2,1,stkId); }); $ (‘#portfolio-‘+articleId).click(function(){ var dispId = $ (this).attr(‘dispId’); pcSavePort(0,1,dispId); }); } $ (‘.mc-modal-close’).on(‘click’,function(){ $ (‘.mc-modal-wrap’).css(‘display’,’none’); $ (‘.mc-modal’).removeClass(‘success’); $ (‘.mc-modal’).removeClass(‘error’); }); function overlayPopupWatchlist(e, t, n,stkId) { $ (‘.srch_bx’).css(‘z-index’,’999′); typparam1 = n; if(readCookie(‘nnmc’)) { var lastRsrs =new Array(); lastRsrs[e]= stkId; if(lastRsrs.length > 0) { var resStr=”; var url = ‘//www.moneycontrol.com/mccode/common/saveWatchlist.php’; $ .get( “//www.moneycontrol.com/mccode/common/rhsdata.html”, function( data ) { $ (‘#backInner1_rhsPop’).html(data); $ .ajax({url:url, type:”POST”, dataType:”json”, data:{q_f:typparam1,wSec:secglbVar,wArray:lastRsrs}, success:function(d) { if(typparam1==’1′) // rhs { var appndStr=”; var newappndStr = makeMiddleRDivNew(d); appndStr = newappndStr[0]; var titStr=”;var editw=”; var typevar=”; var pparr= new Array(‘Monitoring your investments regularly is important.’,’Add your transaction details to monitor your stock`s performance.’,’You can also track your Transaction History and Capital Gains.’); var phead =’Why add to Portfolio?’; if(secglbVar ==1) { var stkdtxt=’this stock’; var fltxt=’ it ‘; typevar =’Stock ‘; if(lastRsrs.length>1){ stkdtxt=’these stocks’; typevar =’Stocks ‘;fltxt=’ them ‘; } } //var popretStr =lvPOPRHS(phead,pparr); //$ (‘#poprhsAdd’).html(popretStr); //$ (‘.btmbgnwr’).show(); var tickTxt =’‘; if(typparam1==1) { var modalContent = ‘Watchlist has been updated successfully.’; var modalStatus = ‘success’; //if error, use ‘error’ $ (‘.mc-modal-content’).text(modalContent); $ (‘.mc-modal-wrap’).css(‘display’,’flex’); $ (‘.mc-modal’).addClass(modalStatus); //var existsFlag=$ .inArray(‘added’,newappndStr[1]); //$ (‘#toptitleTXT’).html(tickTxt+typevar+’ to your watchlist’); //if(existsFlag == -1) //{ // if(lastRsrs.length > 1) // $ (‘#toptitleTXT’).html(tickTxt+typevar+’already exist in your watchlist’); // else // $ (‘#toptitleTXT’).html(tickTxt+typevar+’already exists in your watchlist’); // //} } //$ (‘.accdiv’).html(”); //$ (‘.accdiv’).html(appndStr); } }, //complete:function(d){ // if(typparam1==1) // { // watchlist_popup(‘open’); // } //} }); }); } else { var disNam =’stock’; if($ (‘#impact_option’).html()==’STOCKS’) disNam =’stock’; if($ (‘#impact_option’).html()==’MUTUAL FUNDS’) disNam =’mutual fund’; if($ (‘#impact_option’).html()==’COMMODITIES’) disNam =’commodity’; alert(‘Please select at least one ‘+disNam); } } else { AFTERLOGINCALLBACK = ‘overlayPopup(‘+e+’, ‘+t+’, ‘+n+’)’; commonPopRHS(); /*work_div = 1; typparam = t; typparam1 = n; check_login_pop(1)*/ } } function pcSavePort(param,call_pg,dispId) { var adtxt=”; if(readCookie(‘nnmc’)){ if(call_pg == “2”) { pass_sec = 2; } else { pass_sec = 1; } var url = ‘//www.moneycontrol.com/mccode/common/saveWatchlist.php’; $ .ajax({url:url, type:”POST”, //data:{q_f:3,wSec:1,dispid:$ (‘input[name=sc_dispid_port]’).val()}, data:{q_f:3,wSec:pass_sec,dispid:dispId}, dataType:”json”, success:function(d) { //var accStr= ”; //$ .each(d.ac,function(i,v) //{ // accStr+=”+v.nm+”; //}); $ .each(d.data,function(i,v) { if(v.flg == ‘0’) { var modalContent = ‘Scheme added to your portfolio.’; var modalStatus = ‘success’; //if error, use ‘error’ $ (‘.mc-modal-content’).text(modalContent); $ (‘.mc-modal-wrap’).css(‘display’,’flex’); $ (‘.mc-modal’).addClass(modalStatus); //$ (‘#acc_sel_port’).html(accStr); //$ (‘#mcpcp_addportfolio .form_field, .form_btn’).removeClass(‘disabled’); //$ (‘#mcpcp_addportfolio .form_field input, .form_field select, .form_btn input’).attr(‘disabled’, false); // //if(call_pg == “2”) //{ // adtxt =’ Scheme added to your portfolio We recommend you add transactional details to evaluate your investment better. x‘; //} //else //{ // adtxt =’ Stock added to your portfolio We recommend you add transactional details to evaluate your investment better. x‘; //} //$ (‘#mcpcp_addprof_info’).css(‘background-color’,’#eeffc8′); //$ (‘#mcpcp_addprof_info’).html(adtxt); //$ (‘#mcpcp_addprof_info’).show(); glbbid=v.id; } }); } }); } else { AFTERLOGINCALLBACK = ‘pcSavePort(‘+param+’, ‘+call_pg+’, ‘+dispId+’)’; commonPopRHS(); /*work_div = 1; typparam = t; typparam1 = n; check_login_pop(1)*/ } } function commonPopRHS(e) { /*var t = ($ (window).height() – $ (“#” + e).height()) / 2 + $ (window).scrollTop(); var n = ($ (window).width() – $ (“#” + e).width()) / 2 + $ (window).scrollLeft(); $ (“#” + e).css({ position: “absolute”, top: t, left: n }); $ (“#lightbox_cb,#” + e).fadeIn(300); $ (“#lightbox_cb”).remove(); $ (“body”).append(”); $ (“#lightbox_cb”).css({ filter: “alpha(opacity=80)” }).fadeIn()*/ $ (“#myframe”).attr(‘src’,’https://accounts.moneycontrol.com/mclogin/?d=2′); $ (“#LoginModal”).modal(); } function overlay(n) { document.getElementById(‘back’).style.width = document.body.clientWidth + “px”; document.getElementById(‘back’).style.height = document.body.clientHeight +”px”; document.getElementById(‘back’).style.display = ‘block’; jQuery.fn.center = function () { this.css(“position”,”absolute”); var topPos = ($ (window).height() – this.height() ) / 2; this.css(“top”, -topPos).show().animate({‘top’:topPos},300); this.css(“left”, ( $ (window).width() – this.width() ) / 2); return this; } setTimeout(function(){$ (‘#backInner’+n).center()},100); } function closeoverlay(n){ document.getElementById(‘back’).style.display = ‘none’; document.getElementById(‘backInner’+n).style.display = ‘none’; } stk_str=”; stk.forEach(function (stkData,index){ if(index==0){ stk_str+=stkData.stockId.trim(); }else{ stk_str+=’,’+stkData.stockId.trim(); } }); $ .get(‘//www.moneycontrol.com/techmvc/mc_apis/stock_details/?sc_id=’+stk_str, function(data) { stk.forEach(function (stkData,index){ $ (‘#stock-name-‘+stkData.stockId.trim()+’-‘+article_id).text(data[stkData.stockId.trim()][‘nse’][‘shortname’]); }); }); function redirectToTradeOpenDematAccountOnline(){ if (stock_isinid && stock_tradeType) { window.open(`https://www.moneycontrol.com/open-demat-account-online?classic=true&script_id=$ {stock_isinid}&ex=$ {stock_tradeType}&site=web&asset_class=stock&utm_source=moneycontrol&utm_medium=articlepage&utm_campaign=tradenow&utm_content=webbutton`, ‘_blank’); } }
The market remained in a strong momentum as the benchmark indices sustained northward journey for seventh consecutive session on August 17, tracking positive Asian cues, further correction in oil prices and consistent FIIs buying.
The BSE Sensex rallied more than 400 points to settle at 60,260, while the Nifty50 rose 119 points to 17,944 and formed decent bullish candlestick pattern on the daily charts. All sectoral indices on the NSE barring Nifty Auto settled in the green.
The broader markets also participated in the bull run but underperformed frontliners. The Nifty Midcap 100 and Smallcap 100 indices gained nearly half a percent each.
Stocks that were in action and surpassed benchmarks included Zee Entertainment Enterprises, which was the biggest gainer in the futures & options segment. The stock rose 6.1 percent to Rs 252.30 and formed large bullish candle on daily charts with above average volumes.
Hikal share price clocked 9.2 percent gains at Rs 322.35, continuing uptrend for fourth straight day, and formed strong bullish candlestick pattern on the daily charts for second consecutive session. In fact, it has broken long down sloping resistance trend line adjoining September 16, 2021 and May 6, 2022.
ICICI Securities jumped 8.4 percent to Rs 532, the highest closing level since May 2 and saw bullish candlestick pattern formation on the daily charts with robust volumes. It has broken one month down sloping resistance trend line adjoining June 3 and August 4.
Here’s what Jigar S Patel of Anand Rathi Shares & Stock Brokers recommends investors should do with these stocks when the market resumes trading today:
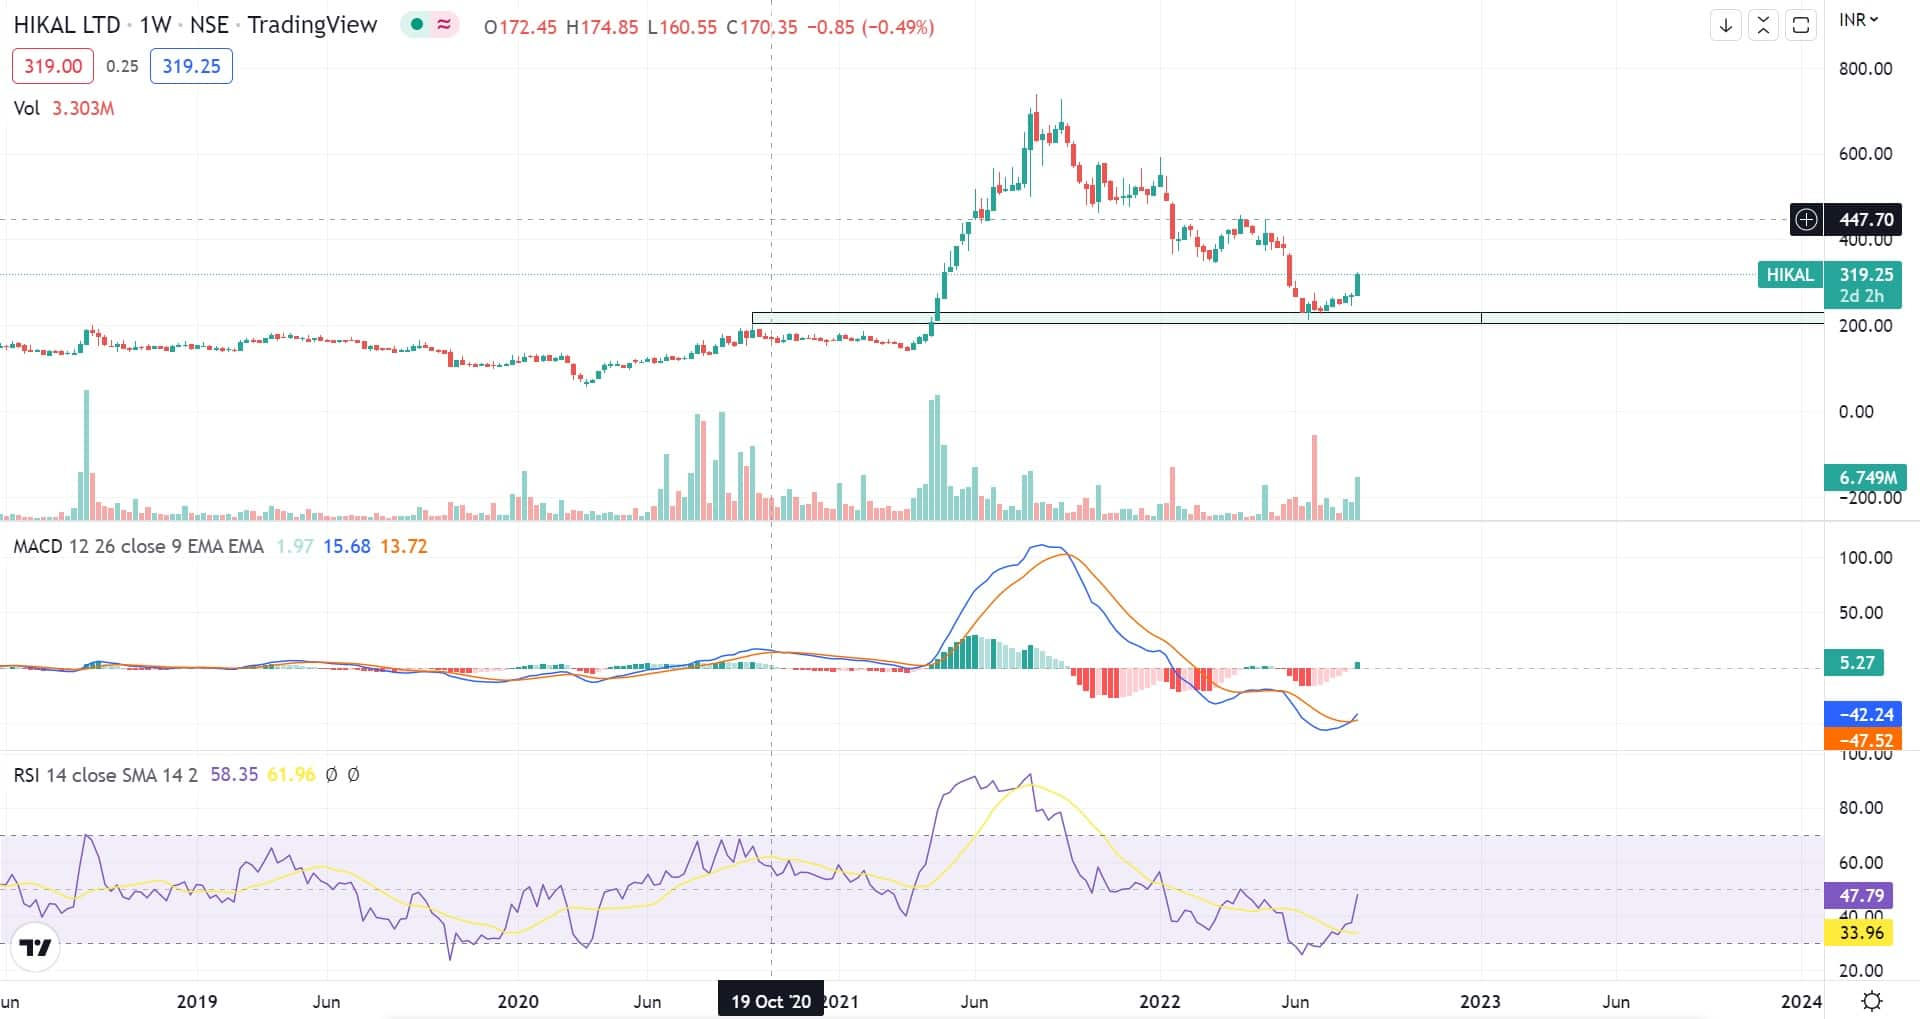
Hikal
Hikal has witnessed a very sharp correction of 61 percent between August 2021 and June 2022. Since then the stock is consolidating between Rs 250-280 (see chart) and it has made a solid base near Rs 270 levels. On August 16, 2022, it gave a classic breakout from said levels along with massive volume picking up which hints at further upside.
On the indicator front, weekly MACD (moving average convergence and divergence) is giving bullish crossover along with weekly RSI (relative strength index) displaying complex structure near oversold zone indicating further upside till Rs 420 with plausible support seen at Rs 270.
One can hold (if already bought) and add (if considering fresh buy) at the current market price.
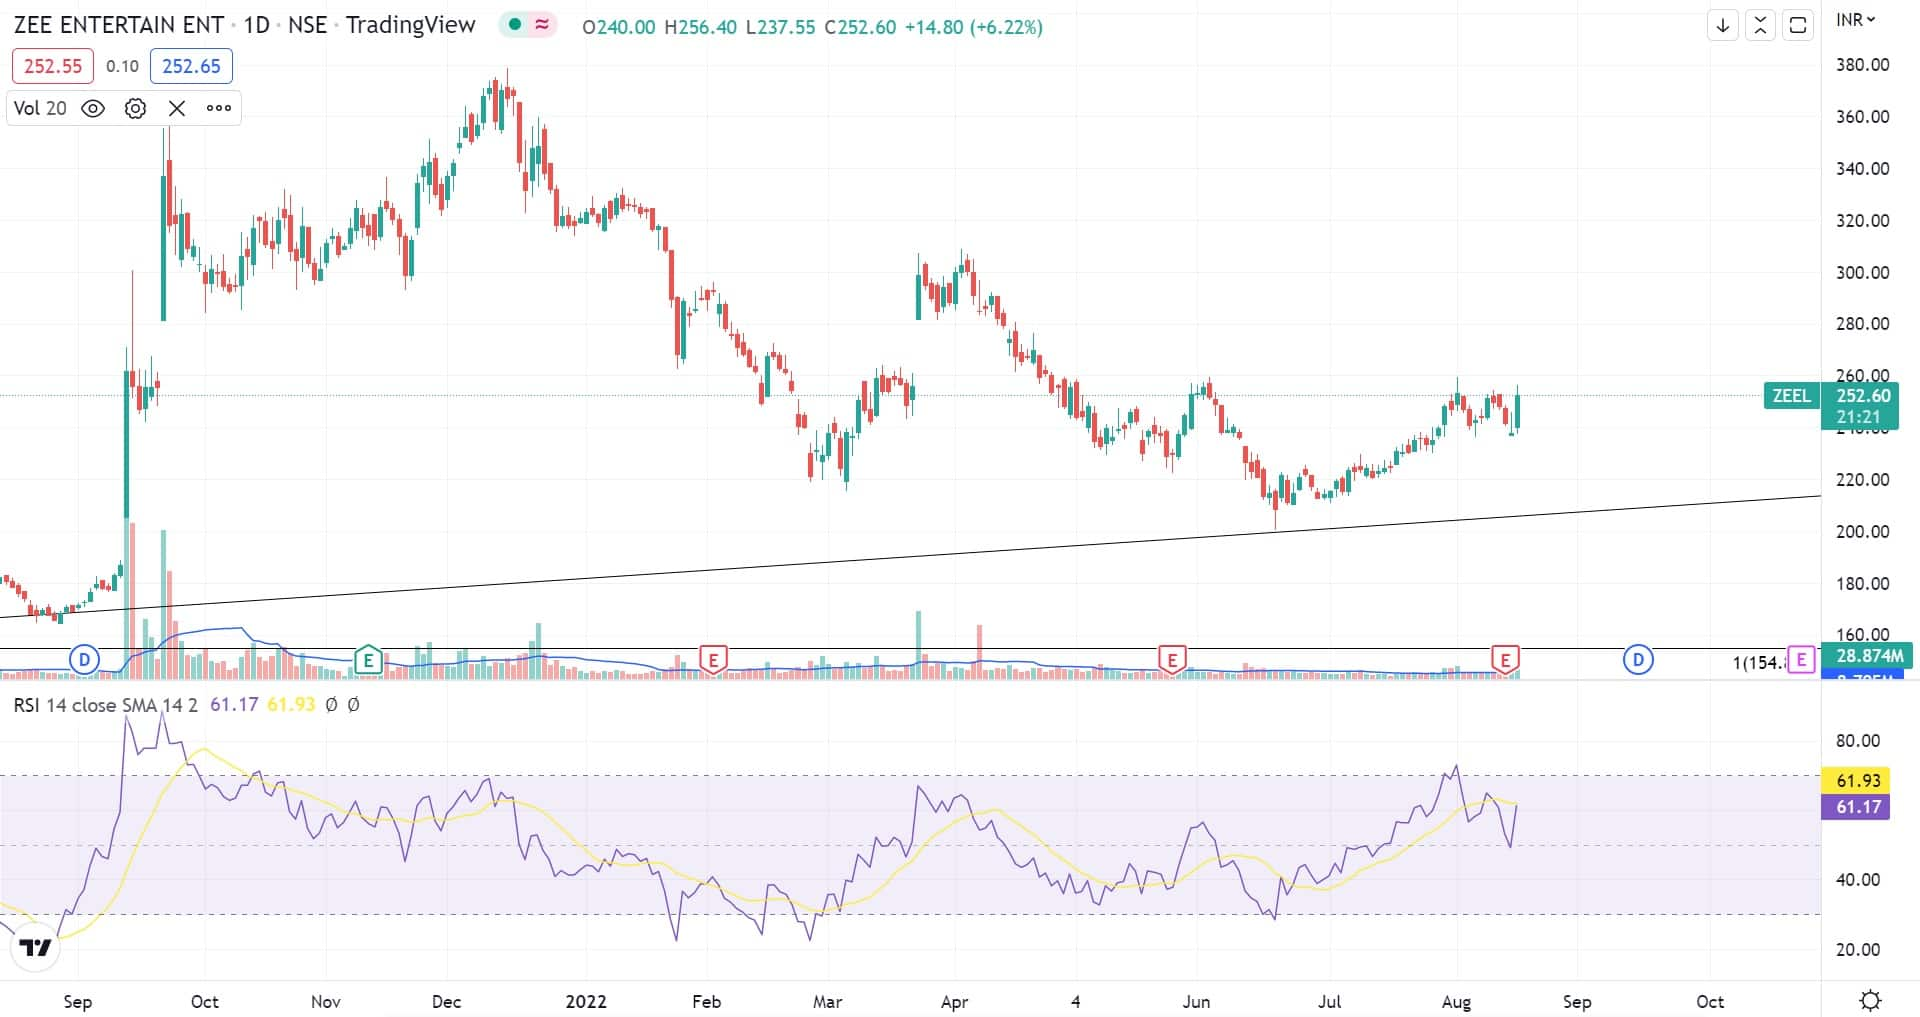
Zee Entertainment Enterprises
On daily chart, ZEE has been making higher highs and higher lows since last couple of months. Also volume is picking up on daily basis which is complementing its up move.
From Indicator perspective, daily RSI (relative strength index) has taken support from Rs 50 levels and bounced back nicely which further confirms upside in counter.
One can buy in small tranche at current levels and buy another tranche at around Rs 240 levels. Upside is expected till Rs 310 and support is seen around Rs 220.
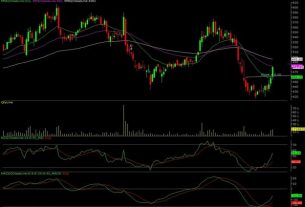
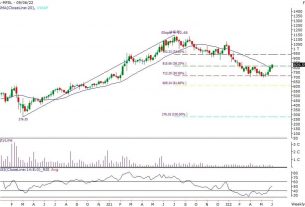
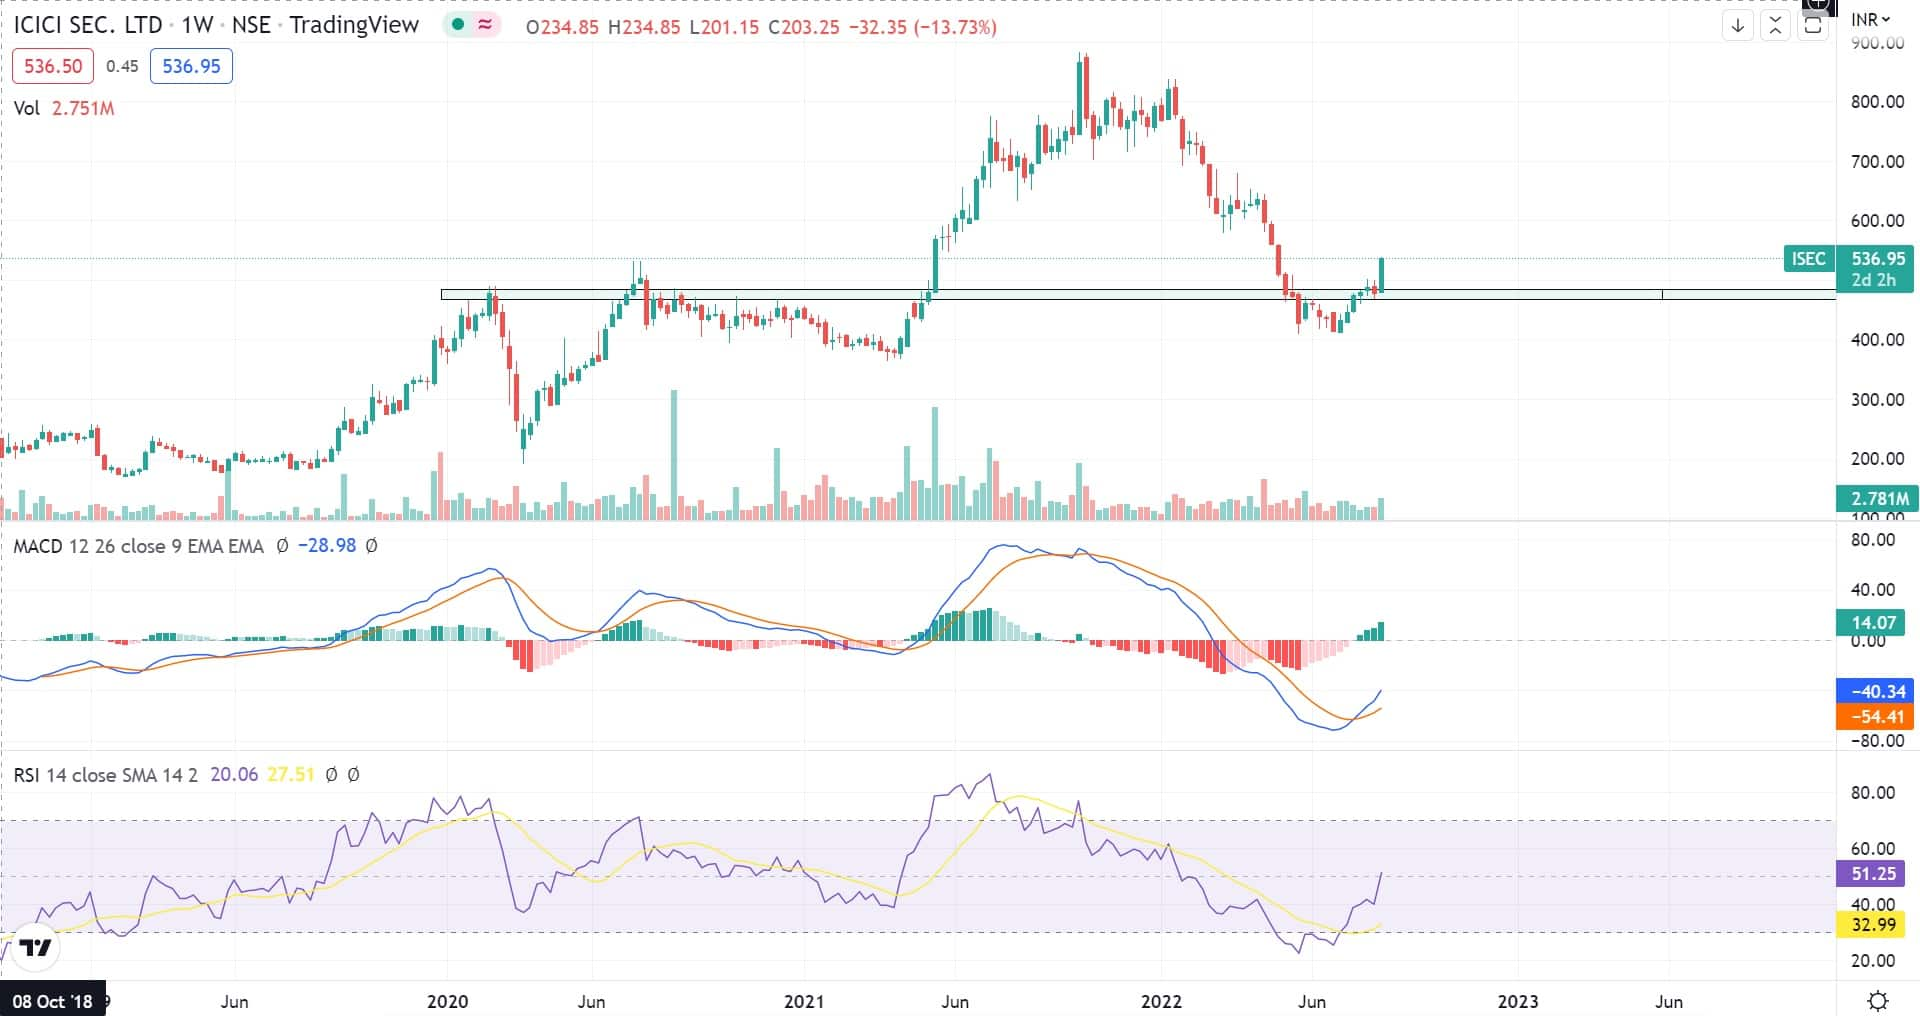
ICICI Securities
ICICI Securities has witnessed a free fall of 52 percent after registering its all-time high of Rs 882 on October 11, 2021. Afterwards the counter has taken nice support near Rs 412 (which is also its historical support) and have made classic come back since then.
On the indicator front, weekly MACD (moving average convergence and divergence) is giving bullish crossover along with weekly RSI (relative strength index) displaying complex structure near oversold zone indicating further upside till Rs 650 with credible support seen at Rs 480.
One can hold (if already bought) and add (if considering fresh buy) at the current market price.
Disclaimer: The views and investment tips expressed by investment experts on Moneycontrol.com are their own and not those of the website or its management. Moneycontrol.com advises users to check with certified experts before taking any investment decisions.