Traders should take one step at a time and avoid aggressive trades, as there are clusters of resistances lined up for the NIfty on the way up
Sunil Shankar Matkar
June 27, 2022 / 09:55 AM IST

‘); $ (‘#lastUpdated_’+articleId).text(resData[stkKey][‘lastupdate’]); //if(resData[stkKey][‘percentchange’] > 0){ // $ (‘#greentxt_’+articleId).removeClass(“redtxt”).addClass(“greentxt”); // $ (‘.arw_red’).removeClass(“arw_red”).addClass(“arw_green”); //}else if(resData[stkKey][‘percentchange’] < 0){ // $ (‘#greentxt_’+articleId).removeClass(“greentxt”).addClass(“redtxt”); // $ (‘.arw_green’).removeClass(“arw_green”).addClass(“arw_red”); //} if(resData[stkKey][‘percentchange’] >= 0){ $ (‘#greentxt_’+articleId).removeClass(“redtxt”).addClass(“greentxt”); //$ (‘.arw_red’).removeClass(“arw_red”).addClass(“arw_green”); $ (‘#gainlosstxt_’+articleId).find(“.arw_red”).removeClass(“arw_red”).addClass(“arw_green”); }else if(resData[stkKey][‘percentchange’] < 0){ $ (‘#greentxt_’+articleId).removeClass(“greentxt”).addClass(“redtxt”); //$ (‘.arw_green’).removeClass(“arw_green”).addClass(“arw_red”); $ (‘#gainlosstxt_’+articleId).find(‘.arw_green’).removeClass(“arw_green”).addClass(“arw_red”); } $ (‘#volumetxt_’+articleId).show(); $ (‘#vlmtxt_’+articleId).show(); $ (‘#stkvol_’+articleId).text(resData[stkKey][‘volume’]); $ (‘#td-low_’+articleId).text(resData[stkKey][‘daylow’]); $ (‘#td-high_’+articleId).text(resData[stkKey][‘dayhigh’]); $ (‘#rightcol_’+articleId).show(); }else{ $ (‘#volumetxt_’+articleId).hide(); $ (‘#vlmtxt_’+articleId).hide(); $ (‘#stkvol_’+articleId).text(”); $ (‘#td-low_’+articleId).text(”); $ (‘#td-high_’+articleId).text(”); $ (‘#rightcol_’+articleId).hide(); } $ (‘#stk-graph_’+articleId).attr(‘src’,’//appfeeds.moneycontrol.com/jsonapi/stocks/graph&format=json&watch_app=true&range=1d&type=area&ex=’+stockType+’&sc_id=’+stockId+’&width=157&height=100&source=web’); } } } }); } $ (‘.bseliveselectbox’).click(function(){ $ (‘.bselivelist’).show(); }); function bindClicksForDropdown(articleId){ $ (‘ul#stockwidgettabs_’+articleId+’ li’).click(function(){ stkId = jQuery.trim($ (this).find(‘a’).attr(‘stkid’)); $ (‘ul#stockwidgettabs_’+articleId+’ li’).find(‘a’).removeClass(‘active’); $ (this).find(‘a’).addClass(‘active’); stockWidget(‘N’,stkId,articleId); }); $ (‘#stk-b-‘+articleId).click(function(){ stkId = jQuery.trim($ (this).attr(‘stkId’)); stockWidget(‘B’,stkId,articleId); $ (‘.bselivelist’).hide(); }); $ (‘#stk-n-‘+articleId).click(function(){ stkId = jQuery.trim($ (this).attr(‘stkId’)); stockWidget(‘N’,stkId,articleId); $ (‘.bselivelist’).hide(); }); } $ (“.bselivelist”).focusout(function(){ $ (“.bselivelist”).hide(); //hide the results }); function bindMenuClicks(articleId){ $ (‘#watchlist-‘+articleId).click(function(){ var stkId = $ (this).attr(‘stkId’); overlayPopupWatchlist(0,2,1,stkId); }); $ (‘#portfolio-‘+articleId).click(function(){ var dispId = $ (this).attr(‘dispId’); pcSavePort(0,1,dispId); }); } $ (‘.mc-modal-close’).on(‘click’,function(){ $ (‘.mc-modal-wrap’).css(‘display’,’none’); $ (‘.mc-modal’).removeClass(‘success’); $ (‘.mc-modal’).removeClass(‘error’); }); function overlayPopupWatchlist(e, t, n,stkId) { $ (‘.srch_bx’).css(‘z-index’,’999′); typparam1 = n; if(readCookie(‘nnmc’)) { var lastRsrs =new Array(); lastRsrs[e]= stkId; if(lastRsrs.length > 0) { var resStr=”; var url = ‘//www.moneycontrol.com/mccode/common/saveWatchlist.php’; $ .get( “//www.moneycontrol.com/mccode/common/rhsdata.html”, function( data ) { $ (‘#backInner1_rhsPop’).html(data); $ .ajax({url:url, type:”POST”, dataType:”json”, data:{q_f:typparam1,wSec:secglbVar,wArray:lastRsrs}, success:function(d) { if(typparam1==’1′) // rhs { var appndStr=”; var newappndStr = makeMiddleRDivNew(d); appndStr = newappndStr[0]; var titStr=”;var editw=”; var typevar=”; var pparr= new Array(‘Monitoring your investments regularly is important.’,’Add your transaction details to monitor your stock`s performance.’,’You can also track your Transaction History and Capital Gains.’); var phead =’Why add to Portfolio?’; if(secglbVar ==1) { var stkdtxt=’this stock’; var fltxt=’ it ‘; typevar =’Stock ‘; if(lastRsrs.length>1){ stkdtxt=’these stocks’; typevar =’Stocks ‘;fltxt=’ them ‘; } } //var popretStr =lvPOPRHS(phead,pparr); //$ (‘#poprhsAdd’).html(popretStr); //$ (‘.btmbgnwr’).show(); var tickTxt =’‘; if(typparam1==1) { var modalContent = ‘Watchlist has been updated successfully.’; var modalStatus = ‘success’; //if error, use ‘error’ $ (‘.mc-modal-content’).text(modalContent); $ (‘.mc-modal-wrap’).css(‘display’,’flex’); $ (‘.mc-modal’).addClass(modalStatus); //var existsFlag=$ .inArray(‘added’,newappndStr[1]); //$ (‘#toptitleTXT’).html(tickTxt+typevar+’ to your watchlist’); //if(existsFlag == -1) //{ // if(lastRsrs.length > 1) // $ (‘#toptitleTXT’).html(tickTxt+typevar+’already exist in your watchlist’); // else // $ (‘#toptitleTXT’).html(tickTxt+typevar+’already exists in your watchlist’); // //} } //$ (‘.accdiv’).html(”); //$ (‘.accdiv’).html(appndStr); } }, //complete:function(d){ // if(typparam1==1) // { // watchlist_popup(‘open’); // } //} }); }); } else { var disNam =’stock’; if($ (‘#impact_option’).html()==’STOCKS’) disNam =’stock’; if($ (‘#impact_option’).html()==’MUTUAL FUNDS’) disNam =’mutual fund’; if($ (‘#impact_option’).html()==’COMMODITIES’) disNam =’commodity’; alert(‘Please select at least one ‘+disNam); } } else { AFTERLOGINCALLBACK = ‘overlayPopup(‘+e+’, ‘+t+’, ‘+n+’)’; commonPopRHS(); /*work_div = 1; typparam = t; typparam1 = n; check_login_pop(1)*/ } } function pcSavePort(param,call_pg,dispId) { var adtxt=”; if(readCookie(‘nnmc’)){ if(call_pg == “2”) { pass_sec = 2; } else { pass_sec = 1; } var url = ‘//www.moneycontrol.com/mccode/common/saveWatchlist.php’; $ .ajax({url:url, type:”POST”, //data:{q_f:3,wSec:1,dispid:$ (‘input[name=sc_dispid_port]’).val()}, data:{q_f:3,wSec:pass_sec,dispid:dispId}, dataType:”json”, success:function(d) { //var accStr= ”; //$ .each(d.ac,function(i,v) //{ // accStr+=”+v.nm+”; //}); $ .each(d.data,function(i,v) { if(v.flg == ‘0’) { var modalContent = ‘Scheme added to your portfolio.’; var modalStatus = ‘success’; //if error, use ‘error’ $ (‘.mc-modal-content’).text(modalContent); $ (‘.mc-modal-wrap’).css(‘display’,’flex’); $ (‘.mc-modal’).addClass(modalStatus); //$ (‘#acc_sel_port’).html(accStr); //$ (‘#mcpcp_addportfolio .form_field, .form_btn’).removeClass(‘disabled’); //$ (‘#mcpcp_addportfolio .form_field input, .form_field select, .form_btn input’).attr(‘disabled’, false); // //if(call_pg == “2”) //{ // adtxt =’ Scheme added to your portfolio We recommend you add transactional details to evaluate your investment better. x‘; //} //else //{ // adtxt =’ Stock added to your portfolio We recommend you add transactional details to evaluate your investment better. x‘; //} //$ (‘#mcpcp_addprof_info’).css(‘background-color’,’#eeffc8′); //$ (‘#mcpcp_addprof_info’).html(adtxt); //$ (‘#mcpcp_addprof_info’).show(); glbbid=v.id; } }); } }); } else { AFTERLOGINCALLBACK = ‘pcSavePort(‘+param+’, ‘+call_pg+’, ‘+dispId+’)’; commonPopRHS(); /*work_div = 1; typparam = t; typparam1 = n; check_login_pop(1)*/ } } function commonPopRHS(e) { /*var t = ($ (window).height() – $ (“#” + e).height()) / 2 + $ (window).scrollTop(); var n = ($ (window).width() – $ (“#” + e).width()) / 2 + $ (window).scrollLeft(); $ (“#” + e).css({ position: “absolute”, top: t, left: n }); $ (“#lightbox_cb,#” + e).fadeIn(300); $ (“#lightbox_cb”).remove(); $ (“body”).append(”); $ (“#lightbox_cb”).css({ filter: “alpha(opacity=80)” }).fadeIn()*/ $ (“#myframe”).attr(‘src’,’https://accounts.moneycontrol.com/mclogin/?d=2′); $ (“#LoginModal”).modal(); } function overlay(n) { document.getElementById(‘back’).style.width = document.body.clientWidth + “px”; document.getElementById(‘back’).style.height = document.body.clientHeight +”px”; document.getElementById(‘back’).style.display = ‘block’; jQuery.fn.center = function () { this.css(“position”,”absolute”); var topPos = ($ (window).height() – this.height() ) / 2; this.css(“top”, -topPos).show().animate({‘top’:topPos},300); this.css(“left”, ( $ (window).width() – this.width() ) / 2); return this; } setTimeout(function(){$ (‘#backInner’+n).center()},100); } function closeoverlay(n){ document.getElementById(‘back’).style.display = ‘none’; document.getElementById(‘backInner’+n).style.display = ‘none’; } stk_str=”; stk.forEach(function (stkData,index){ if(index==0){ stk_str+=stkData.stockId.trim(); }else{ stk_str+=’,’+stkData.stockId.trim(); } }); $ .get(‘//www.moneycontrol.com/techmvc/mc_apis/stock_details/?sc_id=’+stk_str, function(data) { stk.forEach(function (stkData,index){ $ (‘#stock-name-‘+stkData.stockId.trim()+’-‘+article_id).text(data[stkData.stockId.trim()][‘nse’][‘shortname’]); }); });
The market snapped a two-week losing streak to gain around 2.65 percent in the week ended June 24, as the global mood turned positive after fears of a recession triggered by aggressive rate hikes by the US Federal Reserve eased a bit.
Short-covering and value buying was seen in most beaten down sectors. Auto, banks, financial services, FMCG, IT and pharma stocks participated in the run.
The Nifty climbed more than 400 points to 15,699, closing a tad above the previous support line, which has now turned into resistance. The index formed a bullish candle on the daily chart.
After sinking to its lowest level of 15,183 on June 17, 2022 since May 2021, the market seems to have hit a bottom and even moved to the oversold territory on sentiment indicators.
The indicators are moving upwards, with the relative strength index (RSI) showing an uptick on the weekly as well as daily charts. Even the Stochastic has given positive crossovers on the daily as well as weekly scales. The moving average convergence and divergence (MACD) indicator seems to be on the verge of positive crossover and if that happens, it can be considered a strong buy signal, technical experts said.
Experts said there could be more upside, with initial resistance at 15,800 followed by 15,900-16,000 in the monthly F&O expiry week. If the crucial 16,000-mark holds, there could be a strong upside with crucial supports at 15,500-15,400.
“Now, the Nifty has ended right around the previous support zone, which was breached recently. At times, the support broken then becomes resistance on a pullback but looking at the data, we believe the momentum has still more room on the upside,” Ruchit Jain, Lead Research at 5paisa.com, said.
Jain said many stocks which saw short formations in this series and were trading around their supports saw short covering.
The banking space took the lead but sectors such as IT, metals and midcaps have short positions intact and if they see any short covering in the expiry week, it could lift the market higher, he added.
Traders, however, should take one step at a time and avoid aggressive trades, as there are resistances seen one after another on the way up.
As far as levels are concerned, Jain said the Nifty ended near its first resistance of 15,700, then 38.2 percent retracement of the recent correction is around 15,800. The 20-day exponential moving average (EMA) is around 15,865 and the 50 percent retracement, which coincides with the gap area, is around 16,000.
As the index has a cluster of resistances, it will be better to be specific on trades, with supports around 15,500 and 15,360, he added.
Here are the top 10 trading ideas by experts for the next three-four weeks. Returns are based on the June 24 closing prices:
Expert: Ajit Mishra, VP-Research at Religare Broking
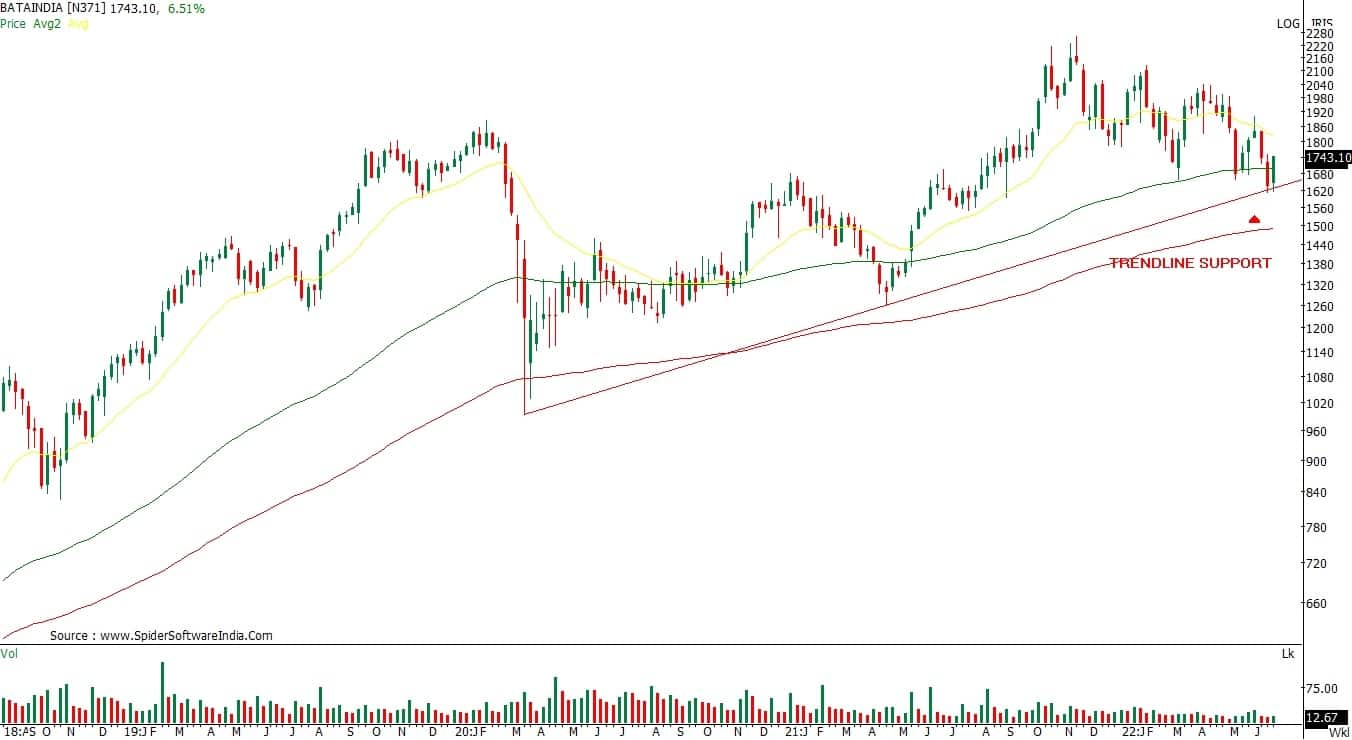
Bata India: Buy | LTP: Rs 1,739.45 | Stop-Loss: Rs 1,630 | Target: Rs 1,930 | Return: 11 percent
Bata India has been in a corrective phase for the last six months after making a record high at Rs 2,262 in November 2021. It has retested the trendline support zone around Rs 1,600 levels lately and is seeing a rebound.
The chart pattern and existence of strong support indicate the possibility of steady recovery. We, thus, recommend accumulating the stock within Rs 1,735-1,745 zone.
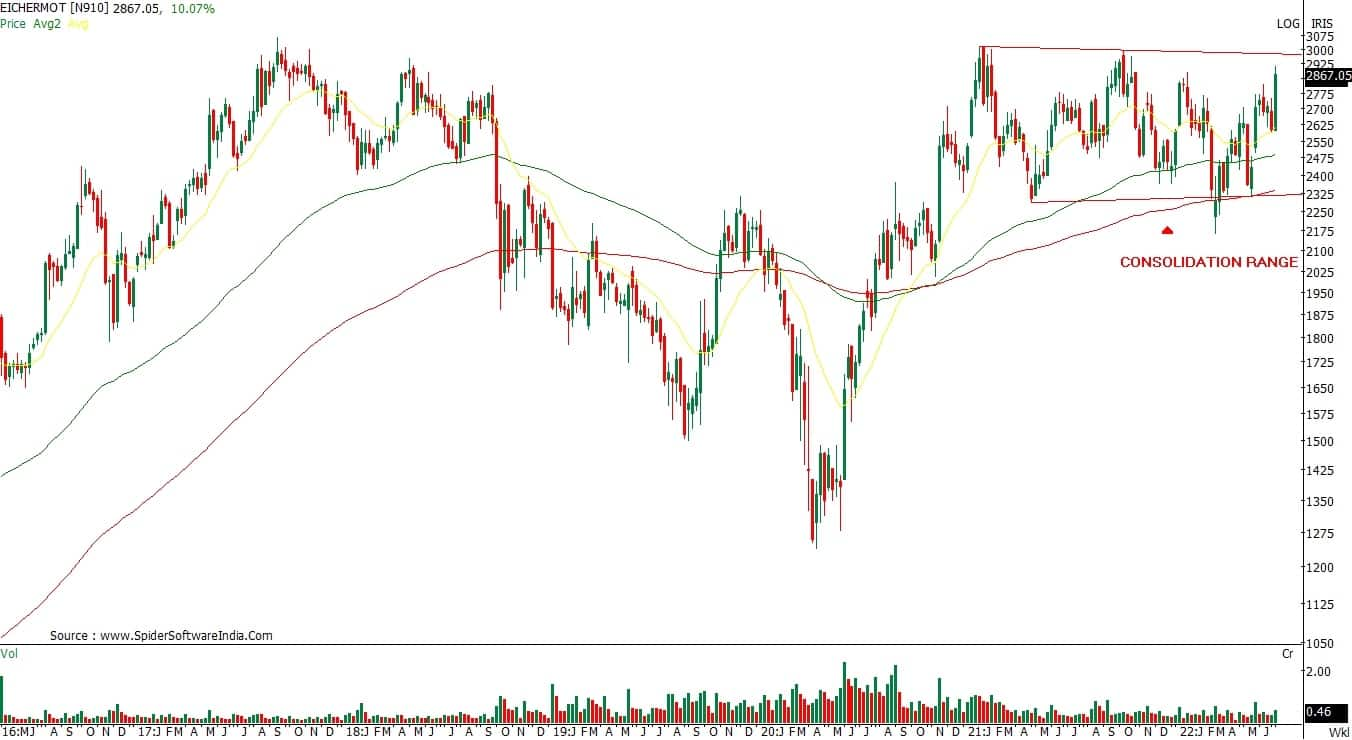
Eicher Motors: Buy | LTP: Rs 2,877.90 | Stop-Loss: Rs 2,650 | Target: Rs 3,200 | Return: 11 percent
Despite the correction, the auto pack has been holding strong and most stocks are trading in tandem with the sector’s trend. The stock has seen consolidating in a broader range of Rs 2,300-3,000 zone for the last five months after retesting its record high in January 2022.
The chart pattern indicates retesting of the upper range soon and possibly a breakout too. We recommend creating fresh longs within Rs 2,830-2,860 levels.
Expert: Jatin Gohil, Technical & Derivative Analyst at Reliance Securities
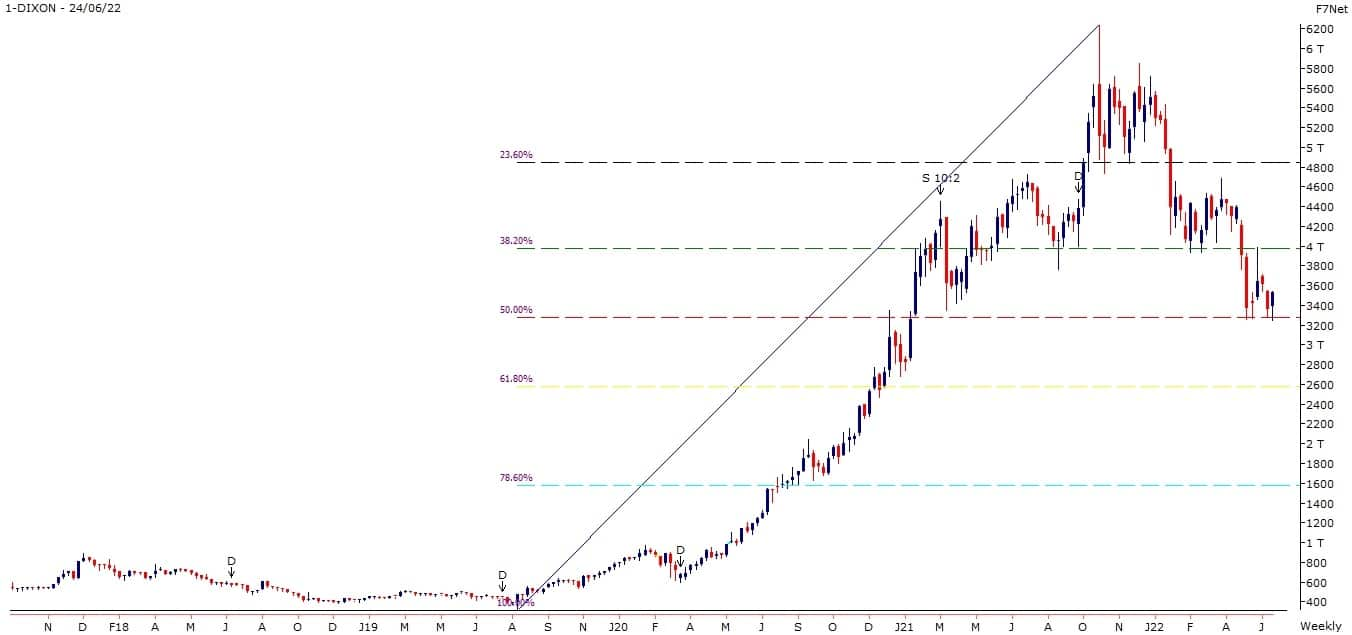
Dixon Technologies: Buy | LTP: Rs 3,527.35 | Stop-Loss: Rs 3,250 | Target: Rs 3,990 | Return: 13 percent
The stock again tested its 50 percent Fibonacci Retracement level of prior mega up-move (Rs 312-6,244), which was placed at around Rs 3,250 and is poised for a rebound. Spike in volume and rise in future open interest signals that major market participants are in favour of the bulls.
In the past, despite a lack of participation, the stock jumped to Rs 4,000 after testing the retracement level. Key technical indicators gave a buy signal post a bullish divergence on the short-term timeframe chart.
We believe the stock can move to Rs 4,000. In case of a decline, it will continue to find support around the Fibonacci retracement level.
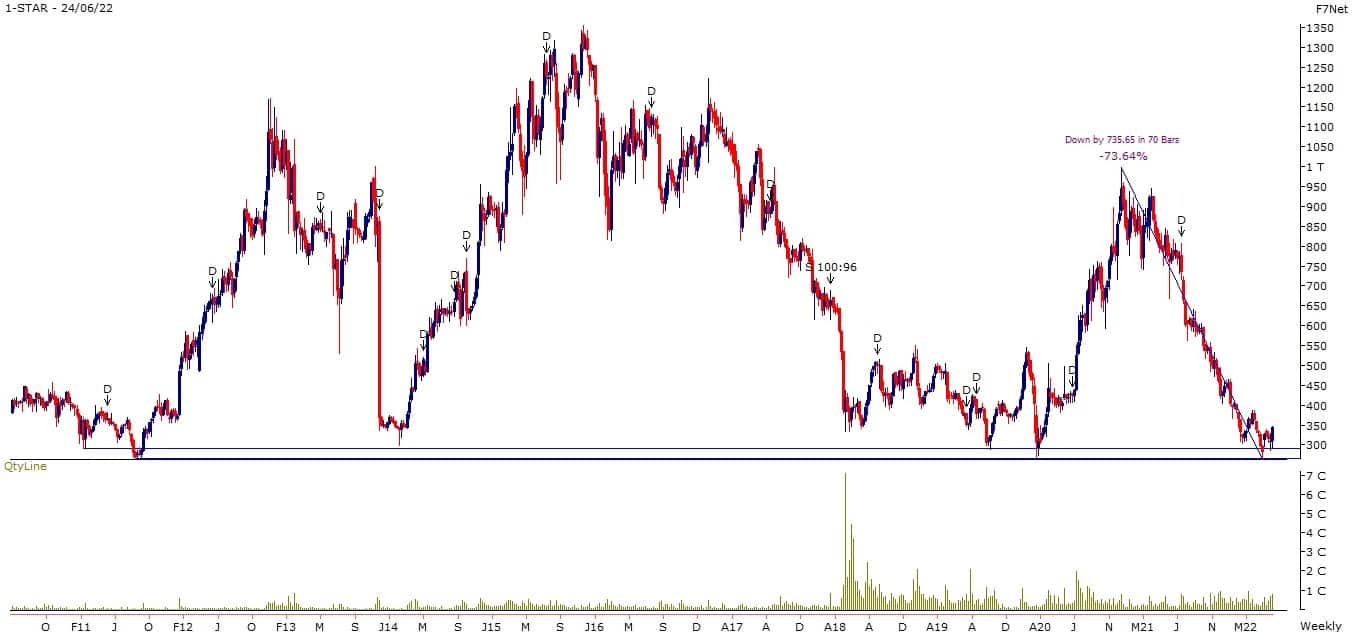
Strides Pharma Science: Buy | LTP: Rs 342.6 | Stop-Loss: Rs 284 | Target: Rs 430 | Return: 25.5 percent
After a higher level of reversal—a 74 percent fall from its prior peak level of Rs 999—the stock formed a base around its long-term demand zone (placed between Rs 265 and Rs 290) and is poised for a rebound.
The bullish reversal formation around the demand zone and positive poised technical indicators signal that the stock is on the verge of a turnaround.
This could lead the stock towards Rs 390-405-430 in the short term. On the lower side, the stock will respect its long-term demand zone.
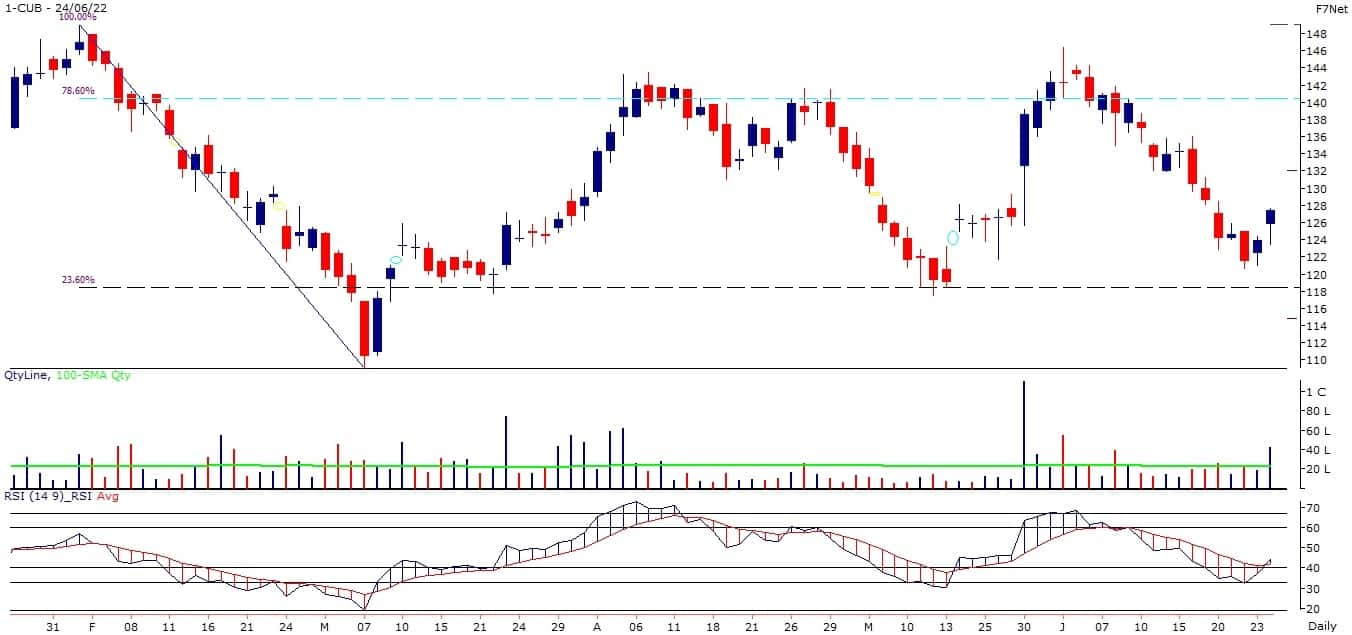
City Union Bank: Buy | LTP: Rs 127.35 | Stop-Loss: Rs 117 | Target: Rs 140 | Return: 10 percent
Since March 10, 2022, the stock has oscillated between its 23.6 percent and 78.6 percent Fibonacci Retracement level of the previous down move (Rs 149-109), which is placed at Rs 118 and Rs 140, respectively.
Recently, the stock reversed before testing its lower band of the range and extended gain subsequently.
Its daily RSI again reversed from its bull-market support zone (40-33) and gave a “buy” signal.
As per the current setup, the stock will move in the upper band of the range. A fresh long position can be initiated and on dips for the desired action.
Expert: Nandish Shah, Senior Derivative & Technical Analyst, HDFC Securities
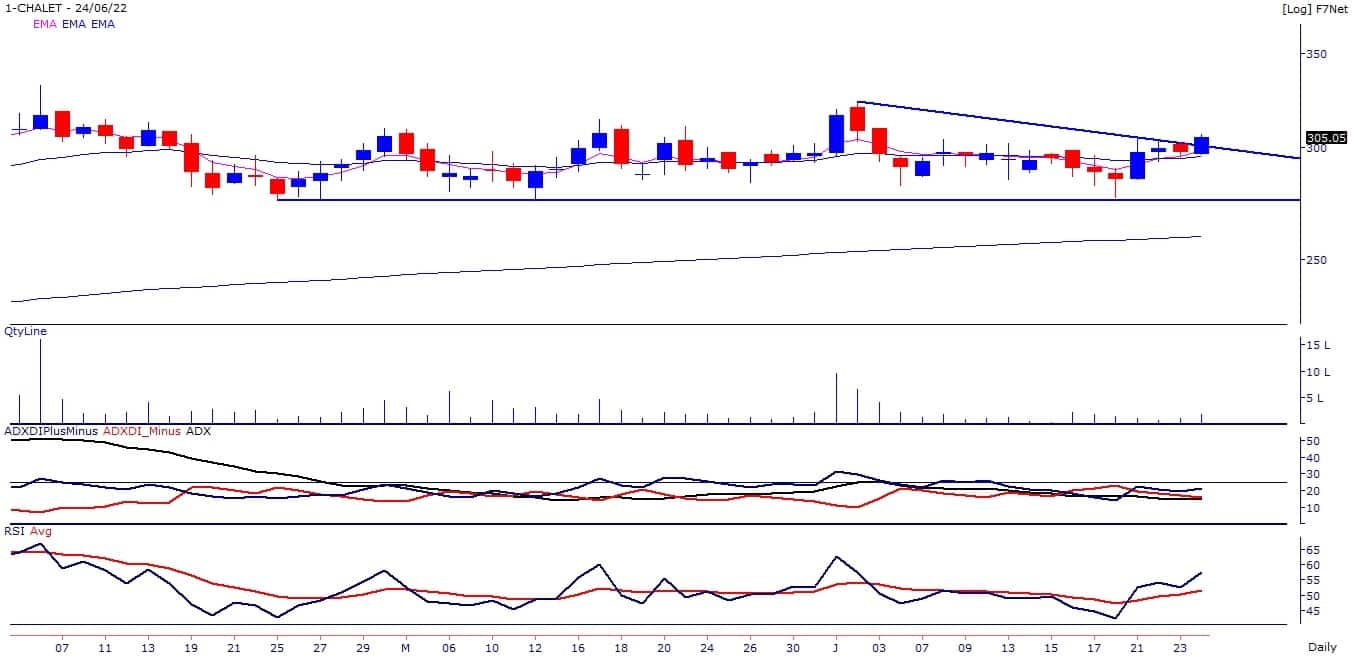
Chalet Hotels: Buy | LTP: Rs 305 | Stop-Loss: Rs 275 | Target: Rs 335-350 | Return: 10-15 percent
The stock price has broken out on the daily chart with higher volumes where it closed at its highest level since June 2, 2022. The primary trend is positive, as the stock is trading above its all-important medium and long-term moving averages.
During the recent correction, the price took support at the 100-day exponential moving average (EMA). The stock price has formed multiple bottoms around Rs 275. The plus directional indicator (DI) is placed above the minus DI, indicating strength in the current uptrend.
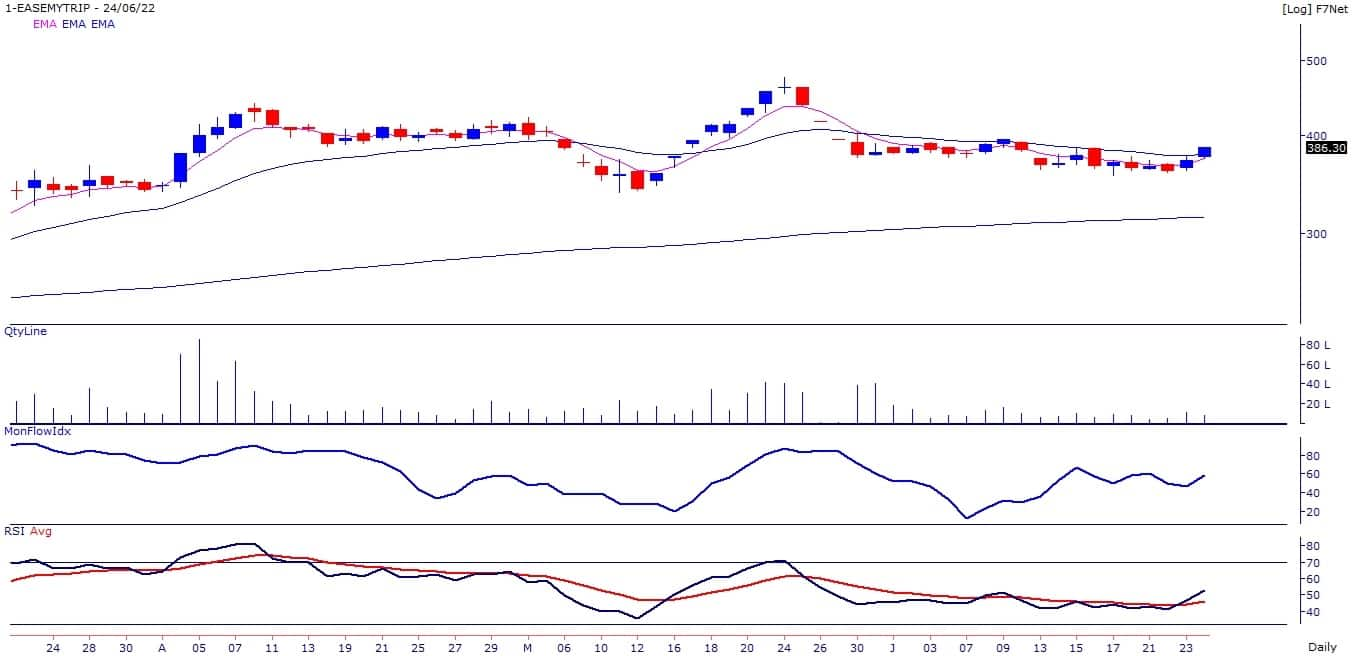
Easy Trip Planners: Buy | LTP: Rs 386.3 | Stop-Loss: Rs 360 | Target: Rs 420-440 | Return: 9-14 percent
The stock price has broken out on the daily chart with higher volumes where it closed at its highest level since June 9, 2022. The stock has formed multiple bottoms around Rs 360.
During the recent correction, the price took support at the 100-day EMA. Momentum oscillators like RSI and money flow index (MFI) are placed above 50 and sloping upwards, Indicating strength in the current uptrend of the stock.
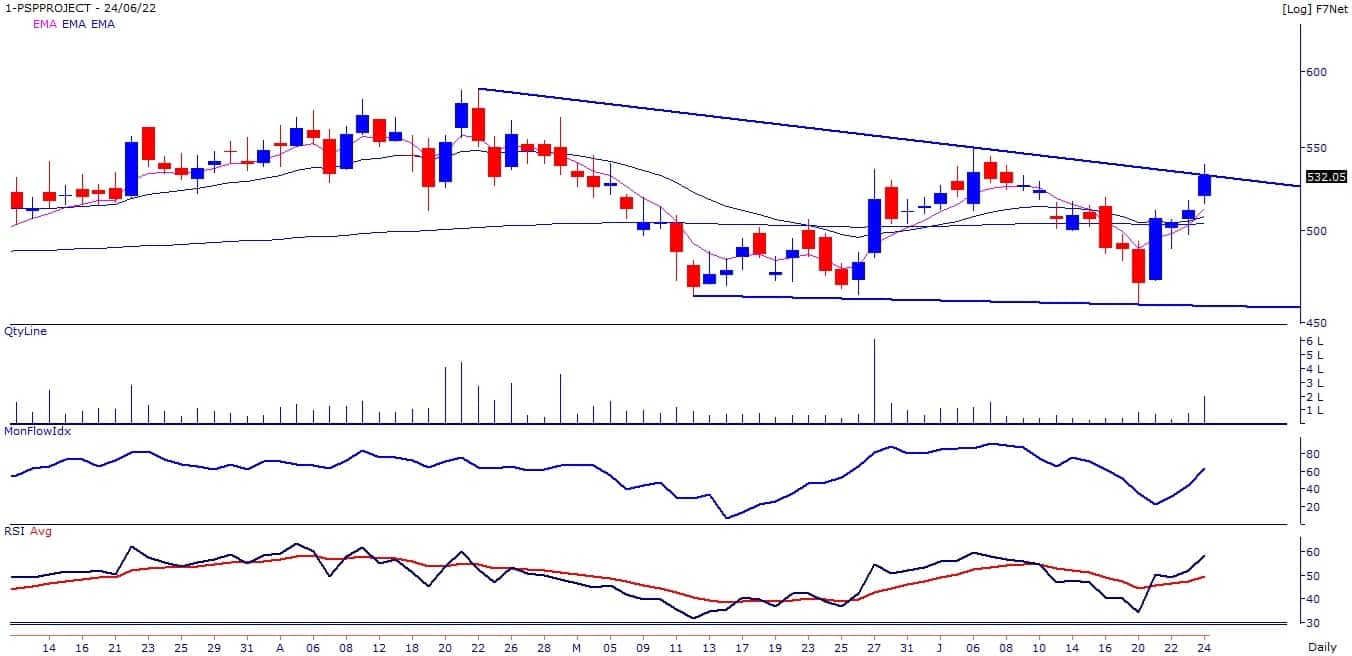
PSP Projects: Buy | LTP: Rs 532 | Stop-Loss: Rs 500 | Target: Rs 600 | Return: 13 percent
The stock price is on the verge of breaking out from the downward sloping trendline on the daily chart, adjoining the highs of April 21 and June 6, 2022.
The short-term trend is positive, as the stock is trading above its 5 and 20- day EMAs. Momentum oscillators like RSI and MFI are placed above 50 and sloping upwards, indicating strength in the uptrend.
Expert: Shrikant Chouhan, Head of Equity Research (Retail) at Kotak Securities
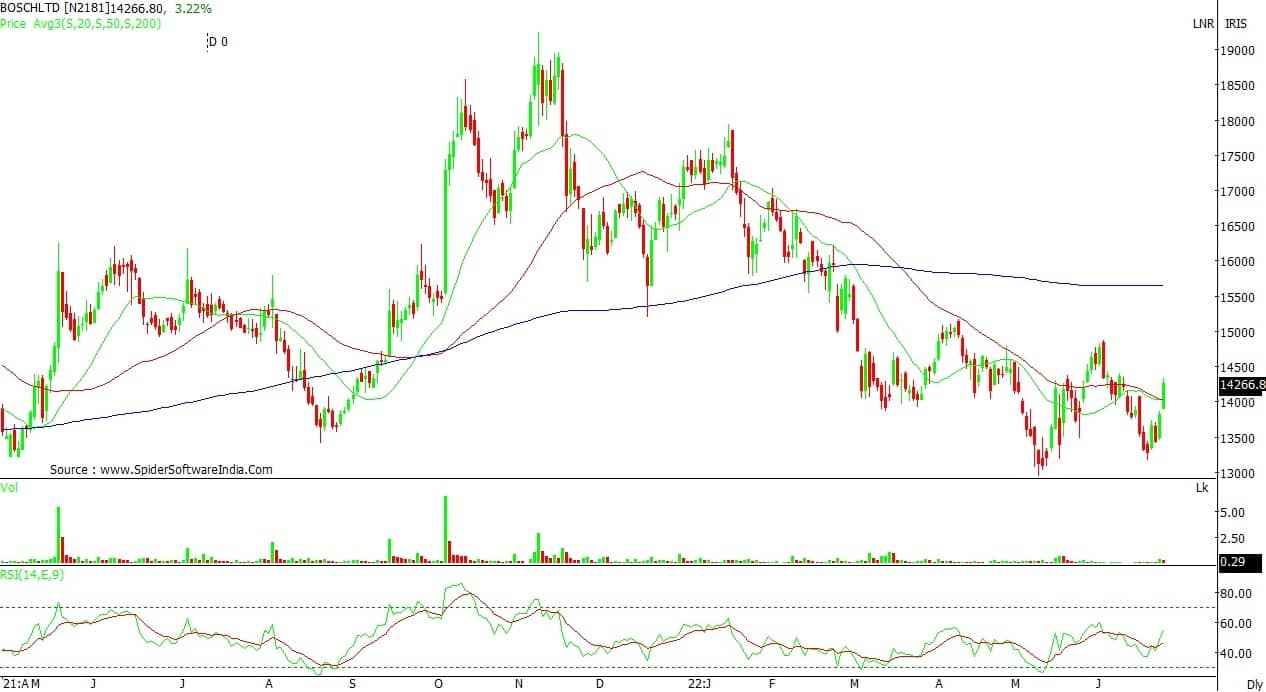
Bosch: Buy | LTP: Rs 14,266.80 | Stop-Loss: Rs 13,600 | Target: Rs 15,400 | Return: 8 percent
The stock formed a higher bottom at Rs 13,165 when the broader market was falling in recent times. If we compare it with the broader market, it is a better performer.
It is also diverging positively on the daily chart, indicating a change in the prevailing trend, which was down.
The stock closed above Rs 14,200 on June 24, which would help the stock to go up to Rs 15,400 with a minor hurdle at Rs 14,900. One can place a stop-loss at Rs 13,600.
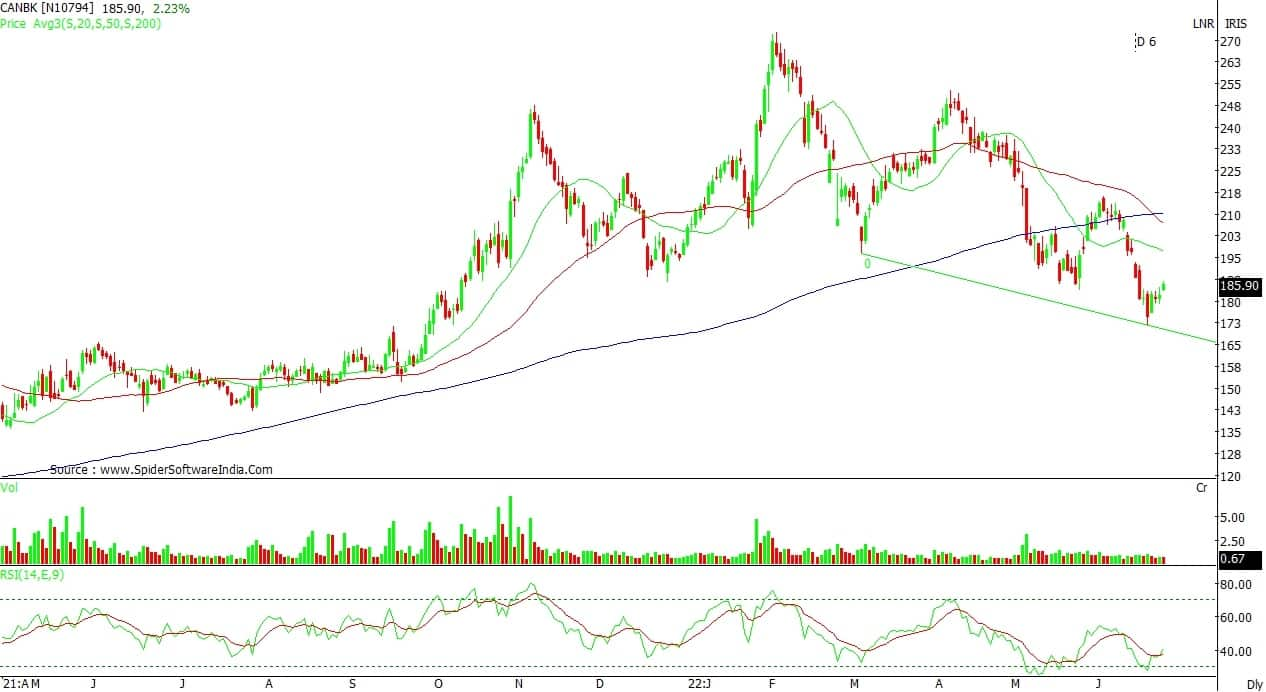
Canara Bank: Buy | LTP: Rs 185.9 | Stop-Loss: Rs 175 | Target: Rs 196-215 | Return: 5-16 percent
The stock was at Rs 273 in February 2022 but slipped to Rs 196 in March. In April, it failed to cross Rs 273, pushing the stock into an extended corrective pattern.
Technically, after touching Rs 172, it rose to Rs 185, which is a sign of completion of the corrective pattern. It was an outperformer in the previous up move in the financial sector and those who have a medium-term outlook for investment should invest in Canara Bank.
Buy at the current level and balance at Rs 175. Keep the stop-loss at Rs 175. On the upside, it will find resistance at Rs 196 and Rs 215.
Disclaimer: The views and investment tips expressed by experts on Moneycontrol.com are their own and not those of the website or its management. Moneycontrol.com advises users to check with certified experts before taking any investment decisions.

