Bear markets that begin with big losses in their first four months last about as long as those that do not. That’s worth pointing out because, after hitting all-time highs on the first trading day of 2022, the major U.S. stock market indexes have suffered an unusually large loss. The Dow Jones Industrial Average’s DJIA, -1.99% January-through-April delcine was the worst start to a calendar year since 1939, for example. The comparable loss for the Nasdaq Composite COMP, -4.29% was the worst start to any year in its history. (It was created in 1971).
It’s not clear what significance these factoids carry. Even if the stock market’s current correction turns into a bear market, the extent of the market’s loss over the past four months affords us no insight into how long that bear market will last.
To show this, I analyzed every bear market since 1900 in the bear-market calendar maintained by Ned Davis Research. I eliminated those bear markets that didn’t last four months, such as the February-March decline in 2020, which lasted just 33 calendar days. A total of 32 bear markets remained.
These 32 bear markets are plotted in the chart below. Notice the lack of any correlation between the magnitude of the bear market’s first-four-month loss and the eventual length of the bear market. The chart also shows the r-squared for the trendline that best fits the data points, and it’s essentially zero — indicating that there is no statistically significant relationship between the two data series.
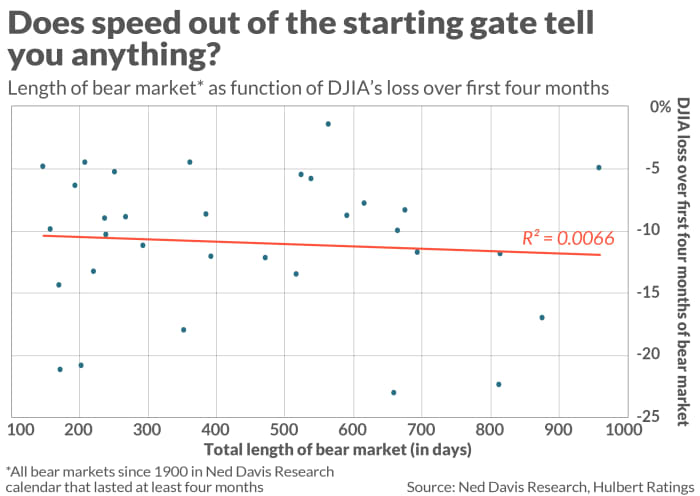
Take the longest bear market in the Ned Davis Research calendar, which is the one lasting from September 1939 to April 1942. The Dow’s loss over the first four months of that bear market was just 4.9%, which is one of the smallest initial losses of any of the bear markets.
What about bear-market losses?
The same conclusion is reached when we shift away from the length of a bear market to the magnitude of its loss. At the 95% confidence level that statisticians often use when determining if a pattern is genuine, there is no correlation between the magnitude of loss in the first four months of a bear market and its loss after those initial four months.
This is once again illustrated by the 1939-42 bear market. After losing 4.9% in its initial four months, the Dow over the remainder of that bear market lost an additional 37.3%. That’s nearly double the average bear-market loss from its four-month mark to its end.
The bottom line? U.S. stocks have lost ground over the past four months at an unusually fast pace. But even if the current correction turns into a full-fledged bear market, the market’s rapid four-month descent tells us nothing about how long that bear market will last or how much further the market will drop before it hits bottom.
We shouldn’t be surprised by this result. The stock market is a forward-looking, discounting mechanism. Where it goes from here will not be a function of what has happened up to this point, since that is already reflected in its current level. Its future course will instead depend on whether things turn out to be better or worse than investors collectively are currently expecting.
Mark Hulbert is a regular contributor to MarketWatch. His Hulbert Ratings tracks investment newsletters that pay a flat fee to be audited. He can be reached at mark@hulbertratings.com
More: The Dow and the S&P 500 are likely falling into a bear market but your portfolio doesn’t have to sink with them
Plus: This Wall Street legend has lived through every bear market since the 1950s. He says the one coming could hit the S&P 500 with a 30% loss