Strap in! It could be a bumpy ride this year.
Financial markets are off to a woeful start for the bulls in 2022. Blame surging inflation, an out-of-step Federal Reserve or a nagging pandemic. But whatever boogeyman market participants identify, there are clear signs that the market is experiencing signs of wear and tear.
Here are a few market-based indicators that imply more bumps in the road ahead, or at least highlight the uneven path of market traversed thus far:
Tech wreck
The Nasdaq Composite COMP, -1.15% has been in a downward spiral. The popular technology index on Wednesday logged its first close in correction territory since last March, closing 10.69% below its Nov. 19 record peak and meeting the commonly used definition for a correction.
On top of that, the Nasdaq on Tuesday notched its first close since April 2020 below a closely watched, long-term trend line — its 200-day moving average. The breach of its 200-day may be a more compelling cause for concern for optimistic investors, given how long the index was able to stay above that level.
See: The Nasdaq Composite just logged its 66th correction since 1971—here’s what history says happens next in the stock market
Moreover, Big Tech has performed the worst within the Dow Jones Industrial Average DJIA, -0.96%, with Salesforce.com CRM, +0.09%, Microsoft Corp. MSFT, +0.22%, Cisco Systems CSCO, -1.39%, Apple Inc. AAPL, -2.10% and International Business Machines Corp. IBM, -1.02% all down sharply in the year to date. Only Intel Corp. INTC, -2.08% has been positive, up 4.1%, so far in January.
Semi’s slammed
Semiconductor stocks have particularly taken it on the chin, with the popular exchange-traded iShares Semiconductor ETF SOXX, -2.94% down 7.3% this week and down 8.5% so far this year, producing underperformance that rivals that of the Nasdaq Composite.
Market technician Mark Newton notes that the semiconductor ETF, a proxy for appetite for the broader technology sector, “just violated lows going back since last November 2021.”
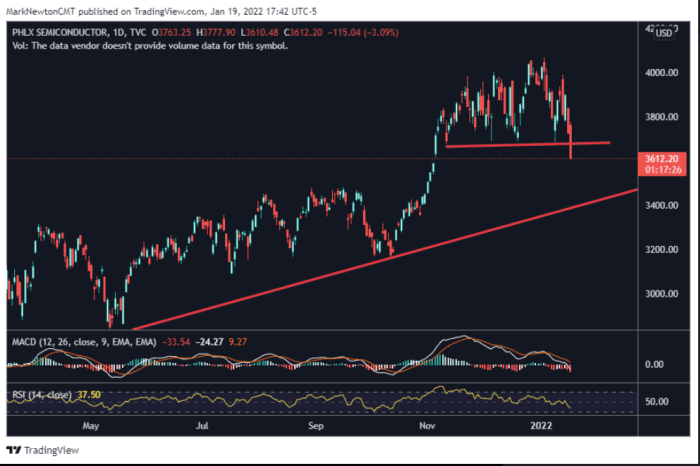
Mark Newton
He makes the case that in the near term, further weakness in SOX looks likely to 3,400, though he is bullish once it gets sufficiently beaten up.
Death cross for the smalls
The Russell 2000 index’s 50-day moving average fell below its 200-day moving average. A “death cross” appears when the 50-day moving average (DMA) crosses below the 200-DMA, which many chart watchers say marks the spot a short-term pullback graduates to a longer-term downtrend.
Small-caps, as measured by the Russell 2000 index RUT, -1.60%, have fared almost as badly as technology shares, down 8.1% in the year to date.
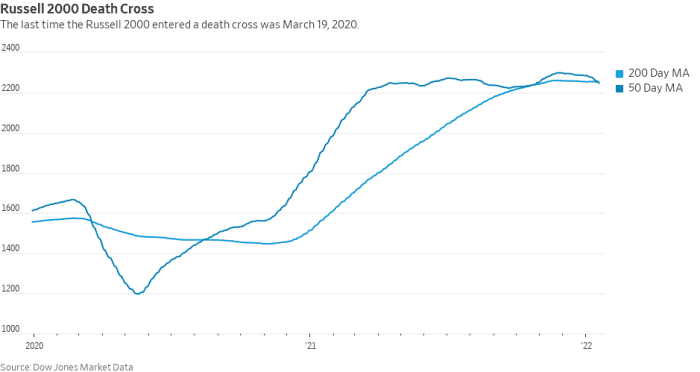
Dow Jones Market Data
According to the folks at Dow Jones Market Data:
- Since inception, the Russell 2000 has entered into a death cross 26 times, including Wednesday’s entrance.
- The average number of trading days the 50-day moving average has stayed under the 200-day moving average is 104 trading days.
- In 2020, the index spent 103 trading days with the 50-day moving average below the 200-day moving average.
The S&P 500’s 100
The S&P 500’s midterm moving average, its 100-day, was breached on Wednesday. The broad-market index hasn’t closed below that level since October. Falling below that mark now may signal that the 200-day trend line may be next to fall.
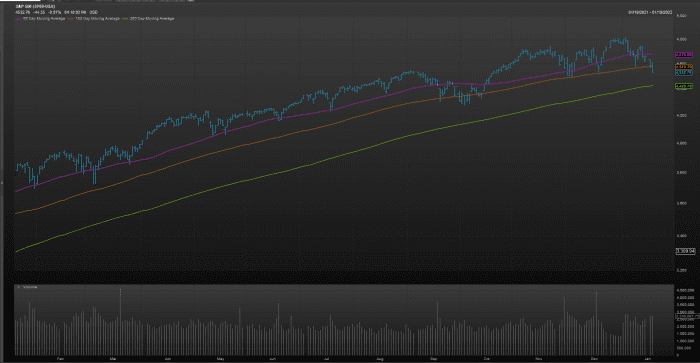
FactSet Inc.
Stock market’s 3K
Newton on Wednesday also noted that the broad market Russell 3000 index RUA, -1.01% was pointing to further deterioration, noting that the index has broken lows going back since December, “which should provide a clear path down to October 2021 lows.”
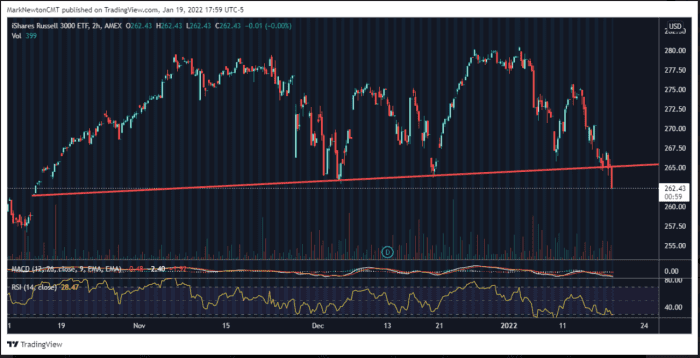
Mark Newton
“This is a very broad-based gauge for U.S. equities, so it remains difficult to think markets are bottoming when this index is hitting multi-month lows. Bottom line, this price deterioration is a new and bearish technical development and momentum is not really all that oversold on most time-frames to argue for any sort of low,” he wrote.
Read: Stock-market warning signal: Here’s what surging bond yields say about S&P 500 returns in next 6 months
Fear gauge
A closely watched measure of stock-market volatility often used as a proxy for investor anxiety, the Cboe Volatiity Index VIX, +4.65%, typically referred by its ticker “VIX,” has been elevated for much of 2022. The index, which has a long-run average around 20, has been hanging above that level. The VIX, which closed at 23.85 on Wednesday, is trading above its 50-day moving average of 20.24, FactSet data shows.
The scope of the stock market’s upside potential may hinge on the VIX, which uses options prices on S&P 500 stocks to gauge implied, or expected, volatility for the benchmark over the coming 30-day period.
The VIX moves inversely to stocks and a rising VIX implies that investors are betting on turbulence in the coming month.
Bouncy bund
One of Europe’s most closely watched government bond yields, the 10-year German Treasury, aka the bund, turned positive for the first time since 2019, highlighting a broad swing higher in global yields.
The yield on the 10-year German bund TMBMKDE-10Y, -0.009% rose as high as 0.021% on Wednesday, with the U.S. 10-year Treasury yield TMUBMUSD10Y, 1.856% at 1.826% and the 2-year Treasury note TMUBMUSD02Y, 1.067% yielding above 1%.
Markets are anticipating an aggressive path for policy from the U.S. Federal Reserve and that is rippling through global markets, least of all those in America.
A rapid rise in yield has been putting pressure on the stock market and a climb in German bunds may contribute to headwinds for the U.S. Treasury because European investors might see some value in buying bunds in positive territory. Yields rise for debt as prices fall.
Slumping sectors
Only two of the S&P 500’s 11 sectors are in positive territory for the year so far: energy SP500.10, -0.66%, up over 16%, and financials SP500.40, -1.65%, rising 0.4%. Technology SP500.45, -1.37% and real estate SP500.60, -1.21% are seeing the steepest declines so far in 2022.