Federal Reserve officials seem to be having some success in calming investor fears over U.S. inflation — the chart below from Deutsche Bank illustrates why that was a tall task.
Deutsche Bank
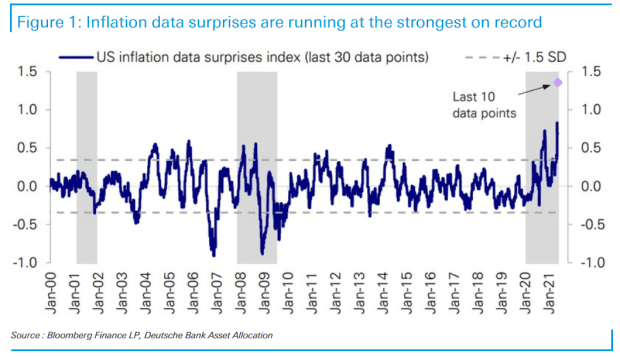
The chart shows U.S. inflation data surprises at their highest in the 20-year history of the series, said strategist Jim Reid, referring to a note by equity strategist Parag Thatte. The last 10 data points were “almost off the chart,” he noted.
Investors and economists had long been gearing up for a significant pickup in inflation as vaccine rollouts set the stage for a bout of pent-up demand to meet supply shortages caused by pandemic-induced bottlenecks. Base effects — comparisons with year-ago price levels depressed due to the pandemic — were also anticipated to spur a run of hot inflation numbers. Those were all among reasons the Federal Reserve had assured it would look at rising inflation as “transitory,” or likely to fade.
But an even hotter-than-expected April consumer-price index reading earlier this month, showing that inflation jumped 4.2% year-over-year, sparked a tech-led stock-market pullback and a modest and short-lived rise in Treasury yields.
Markets seem to have calmed down after a series of public remarks by Fed policy makers. They overwhelmingly, though not unanimously, repeated that a sharp jump in inflationary pressures would prove temporary and that it remained too early to begin thinking about discussing when to begin slowing bond purchases or otherwise pulling back on extraordinary monetary policy measures aimed at boosting the economy and healing the labor market.
See: Fed’s Evans says recent strong inflation readings are not the start of persistent move higher
Stocks were mixed in featureless trading Tuesday afternoon, with the Dow Jones Industrial Average DJIA, -0.13% threatening to snap a three-day winning streak. The blue-chip gauge and the S&P 500 SPX, -0.16% have turned higher for the month. The yield on the 10-year Treasury note TMUBMUSD10Y, 1.562% slipped back below 1.6%.
Read: Inflation scare? The stocks that perform best — and worst — when prices rise
But Reid noted how extraordinary the overall run of inflation surprises has been. As the chart shows, surprises during the 2007-2009 recession were sharply negative and didn’t overshoot afterward. During the pandemic, inflation didn’t undershoot, but is now “overshooting massively.”
Also see: ‘Good’ inflation or ‘bad’? Investors are scared because they can’t tell difference just yet
And while it is easy to blame transitory factors, that doesn’t explain the surprises.
After all, Reid wrote, “these were surely all known about before the last several data prints and could have been factored into forecasts. That they weren’t suggests that the transitory forces are more powerful than economists imagined or that there is more widespread inflation than they previously believed.”
Indexes that track data surprises have always reverted to the mean, Reid said, so it should be expected that the same will occur with the inflation index. But the data run might still give investors, and policy makers, grounds for concern.
“The fact that we’re seeing an overwhelming positive beat on U.S. inflation surprises in recent times must surely reduce the confidence to some degree of those expecting it to be transitory,” Reid said.