
The sense of déjà vu is inescapable. Just like the beginning of the last financial year in April 2020, this month brings with it an increasing number of new COVID-19 cases. And while a nationwide lockdown is ruled out for now, simply because of the damage that might do to the economy, localised curfews and lockdowns have begun.
On April 5, 2021, India reported 96,982 coronavirus infections, pushing the nationwide COVID-19 tally to 1.27 crore. The death toll increased to 1.65 lakh with 446 new fatalities. Registering a steady increase for the 27th day in a row, the active cases have increased to 7.88 lakh.
Meanwhile, a total of 8.31 crore vaccinations have been administered in the country so far, including a record 43.01 lakh vaccinations on April 5, as per the Ministry of Health and Family Welfare. A number of districts and cities, including the economic centres of Mumbai and Delhi, have announced night curfews.
This then is the greatest challenge India’s economic policymakers face. The Centre itself projects a real gross domestic product growth rate of around 11 percent for 2021-22, while other agencies see India’s GDP growth rate in the 10-12.5 percent range, the highest anywhere in the world. These forecasts, however, were made before the second wave of COVID-19 infections hit many parts of the country.
From a 24.4 percent contraction in April-June 2020, India’s GDP growth entered positive territory at 0.4 percent in October-December. However, even before the new spurt in COVID cases, analysts were warning that the economy was correcting itself after being driven by pent-up festival demand from June to December.
Moneycontrol looks at some high-frequency indicators, some of which have shown substantial improvement since the lockdown, while others point to a slight cooling down in economic activity. Overall though, the numbers still seem on a stronger footing now than how things were a year earlier, with the Finance Ministry expressing confidence that the economy is better poised to deal with any headwinds due to a second wave.
Goods and Service Tax
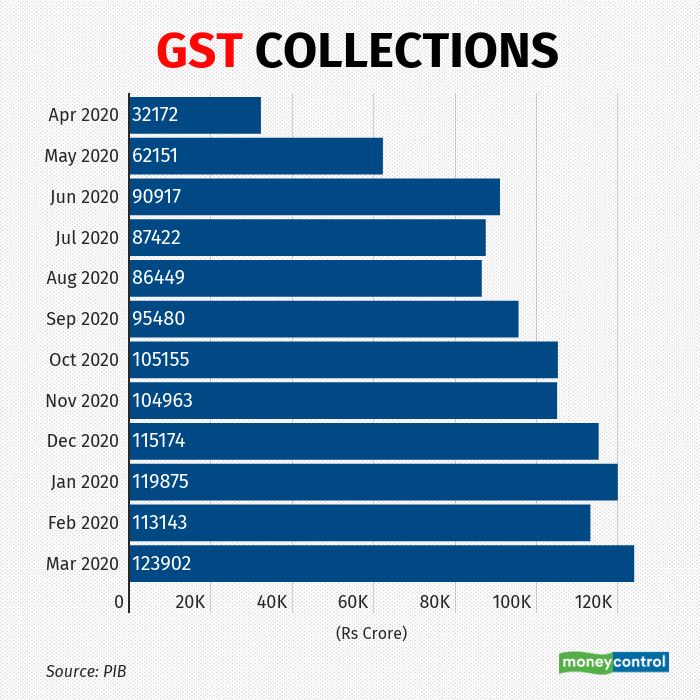
Perhaps the strongest indicator of India’s economic resilience, Goods and Service Tax collections for March came in at Rs 1.24 lakh crore, the highest-ever monthly collections since the nationwide tax was introduced in July 2017.
Since September, monthly GST collections have been higher than the year-ago period, with the revenues for March being 27 percent higher than the same month last year. “The GST revenue witnessed a growth rate of –41 percent, -8 percent, 8 percent and 14 per cent in the first, second, third and fourth quarters of this financial year, respectively, as compared to the same period last year, clearly indicating the trend in recovery of GST revenues as well as the economy as a whole,” the Finance Ministry said in a statement.
Apart from economic recovery, closer monitoring against fake billing, deep-data analytics, e-way bills coming fully online and effective tax administration have also contributed to the steady increase in GST revenue over the last few months.
Manufacturing activity – PMI
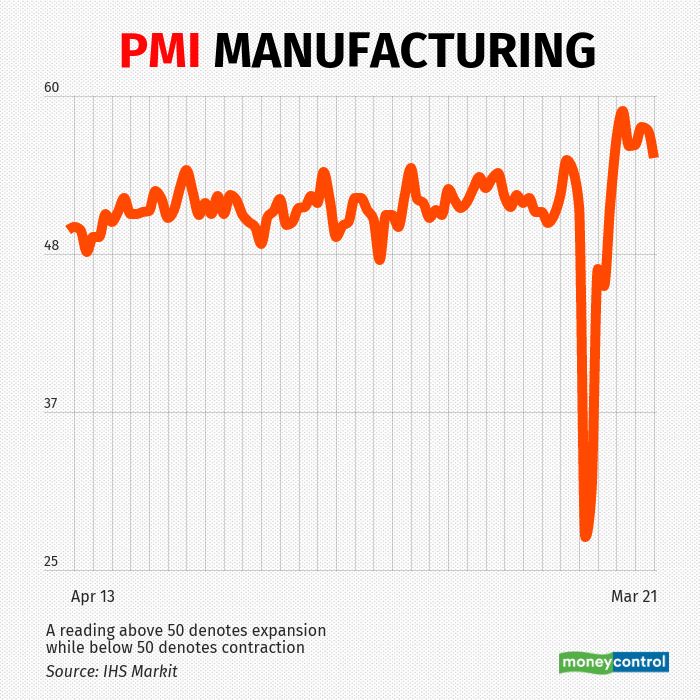
After a steady rise over the previous three months, growth in manufacturing activity hit a speed breaker at the end of the financial year in March, as is evident from the PMI index. The IHS Markit Manufacturing PMI fell to a 7-month low of 55.4 in March, down from 57.4 in September. While manufacturers have now seen sales rise for the eighth-straight month, fuelled by a growth in both domestic orders and export contracts, the pace of growth has slowed. This has been blamed on the renewed escalation of the (COVID-19) pandemic and subsequent restrictions imposed by state governments, according to IHS Markit.
In PMI parlance, a print above 50 means expansion, while a score below that denotes contraction. However, it should be noted that the PMI is a month-over-month indicator, showing improvement over the previous month, and not over the previous year.
Manufacturing PMI fell for four consecutive months in the beginning of the 2020-21 financial year owing to the nationwide lockdown but has continued to register overall growth since August. Worryingly though, despite this growth, manufacturers have continued to cut jobs, with jobs being lost every single month of the financial year.
Digital payments – UPI
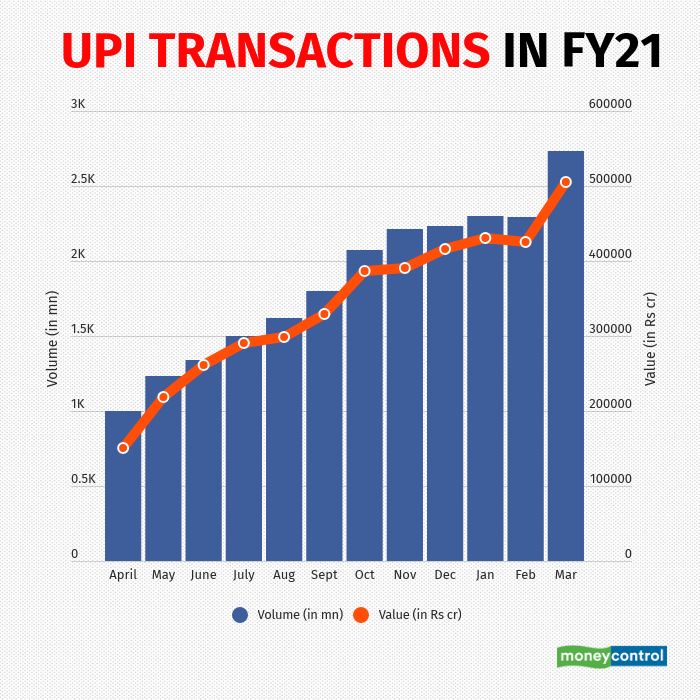
Successive nationwide and regional lockdowns seem to have hastened the adoption of digital payments by more Indians. According to data from the National Payments Corporation of India, unified payments interface (UPI) usage witnessed a steady rise throughout 2020-21, both in terms of volume and value.
The government announced a nationwide lockdown in March-end to tackle the spread of the COVID-19 pandemic, bringing economic activities to a grinding halt. March data shows UPI transactions worth Rs 2.06 lakh crore, which dropped by 27 percent month-on-month in April. But from then onwards, UPI transactions have seen an unprecedented jump.
In April, India saw UPI transactions worth Rs 1.51 lakh crore which has jumped to Rs 5.04 lakh crore by the end of the financial year. The 2.3 times jump came as a result of Indians showcasing a greater dependence on digital payments after months of lockdown. Surveys by financial payment companies have shown reliance on technology for conducting both daily and high-value transactions has exponentially increased during this period.
On the other hand, the volume of transactions has seen a similar explosion, leading industry experts to suggest that uptake of digital payments has occurred at a more grassroots level than earlier before, spanning the country. The number of UPI transactions had been on the cusp of a billion transactions back in April, at 999.5 million. In March 2021, it reached 2.73 billion.
Industrial Production – IIP
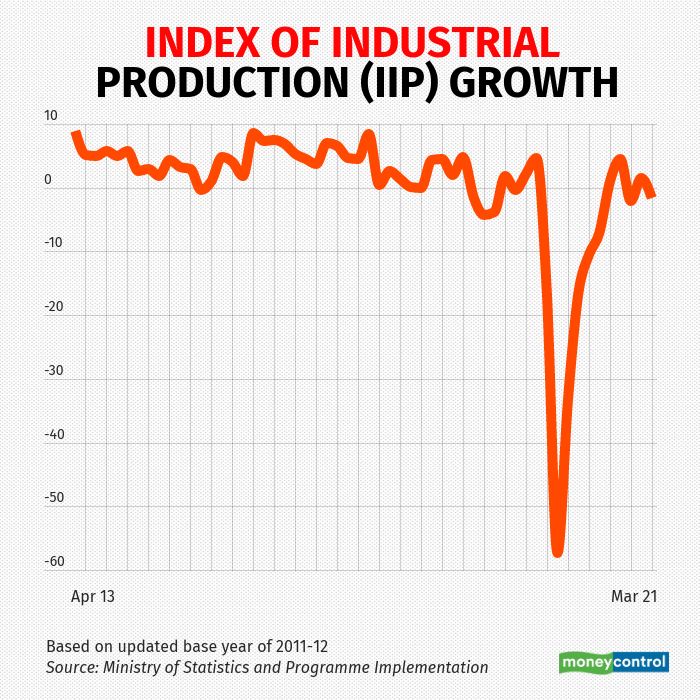
Negotiating through a difficult year marred by nationwide and regional lockdowns and crashing demand, industrial production in the country, as is measured by the Index of Industrial Production (IIP), has contracted as of January. After February data for the eight core sectors of the economy showed a sharp curve onto contraction, experts now predict the IIP may also follow suit into negative territory.
Industrial production in the country has seen a difficult year, with the IIP decreasing seven out of the 10 months of the 2020-21 financial year that data has been released for. The latest 1.6 percent fall in January is attributed to a 2 percent fall in manufacturing output, reversing the gains from December. Of the 23 sub-sectors within manufacturing, as many as 18 posted a year-on-year contraction. This is similar to the height of the pandemic in April 2020, when a similar number of critical sub-sectors had seen a decline.
The year had begun on a dubious record-breaking note. Inherent stress in the sector had become visible in March 2020 but reached a peak during April when output fell by a massive 57.3 percent. IIP had come back to the growth charts in September 2020. Experts had initially suggested the momentum to continue as industrial output gets a boost from rising demand and an uptick in global trade. But the growth spurt had fizzled out just two months later from November onwards.
While the advantage of a low base effect in March may pick up the figures, real industrial activity is expected to remain far below pre-pandemic levels.
Vehicle Sales
After significant turmoil in their production, transportation and sales chains, vehicle manufacturers have been able to reverse the effects of the pandemic to end the year with growth. But the pace of sales growth is yet to match the expectations. Industry insiders say expectations had been high in the days immediately after the lockdowns were reversed. Companies had bet on a resurgence of demand to bring them out of the slump the industry had sunk into even before the pandemic. That is yet to be achieved.
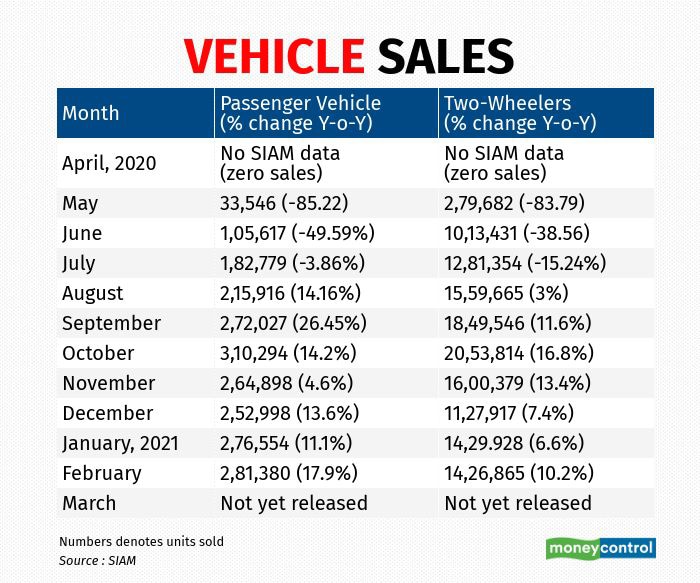
Vehicle sales remain a key indicator of domestic demand in India, a country where the middle class continues to expand, despite the pandemic. The data from the Society of Indian Automobile Manufacturers maintains that in April 2020, not a single vehicle was officially sold anywhere in the country. When the lockdown was slowly lifted, sales of both passenger vehicles and two-wheelers tumbled by about 85 percent.
Both categories saw a return to growth from August onwards as the trends reversed with the festive season nearing. Since then, September has seen the biggest year-on-year rise in passenger vehicle sales at a growth of 26 percent, while October has seen the highest for two-wheeler sales with a 16.8 percent rise. After a slow period in end-2020, sales growth figures have risen to single digits in February.
Overall, SIAM believes the less steep fall in two-wheeler sales indicated that the rural areas came out of the lockdown in a much better shape than urban India, which saw both the highest number of cases as well as deaths. The relative health of the rural economy is also borne by the available GDP data, as agriculture was the only sector which showed growth.?
Income Tax
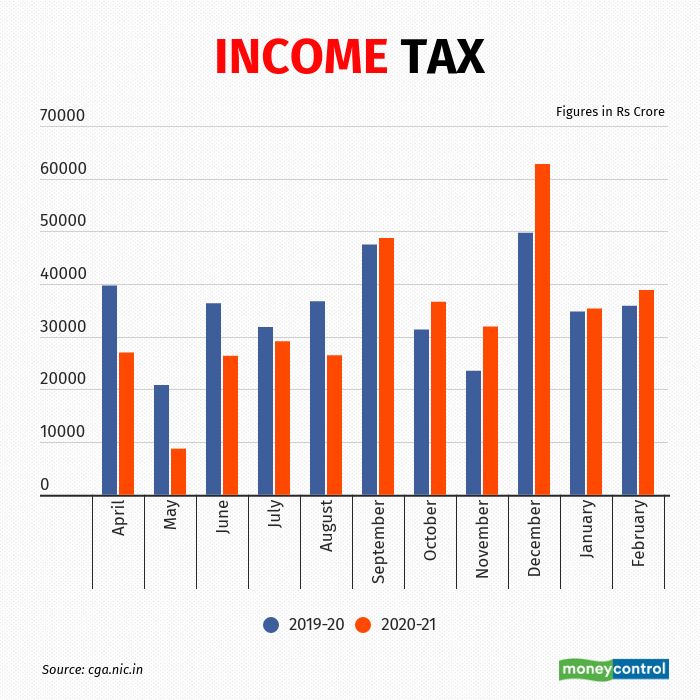
The data makes for an interesting read. The net income tax collections in December were Rs 62,768 lakh crore, the highest monthly receipts in 2020-21, before coming down sharply in January and February. And this is where the concerns raised by many economists are illustrated.
However, what is encouraging is that just like GST, monthly income tax collections have also been higher compared to the year-ago period, since September.
Real Estate
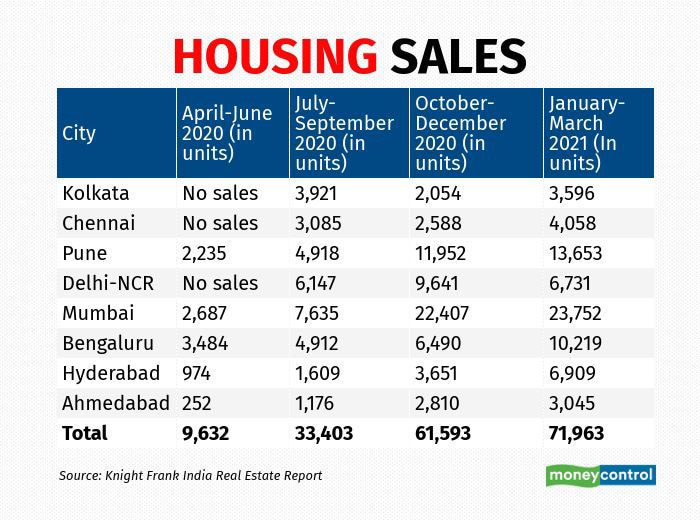
The housing market is clearly seeing a boom. As the chart shows, almost all the major cities have registered a substantial increase in housing sales each quarter, with the exception of Kolkata.
The biggest boom in the time of pandemic has been seen in Pune and Mumbai, which incidentally are now the two worst-affected cities in the second wave of COVID infections. From sales of 2,235 housing units in April-June 2020, Pune saw 13,653 units being sold in January-March 2021. For Mumbai, it was 23,752 units, compared with 2,687 units three quarters earlier.
In fact, Mumbai, Pune and Bengaluru accounted for 66 percent of all housing units sold in the eight cities being tracked by real estate consultancy Knight Frank, in the January-March quarter.