Ratio line shows a reversal from pattern re-test zone (i.e. peak of August 2018). Fall has been steep, yet it is trading above its 50-EMA.
Pritesh Mehta
February 28, 2021 / 07:31 PM IST

Esab India | Acacia Partners LP sold 3,31,649 shares in the company at Rs 1,865 share in the company, whereas SBI Mutual Fund acquired 3 lakh shares at same price on the NSE. Acacia II Partner LP & others reduced stake in the company to 6.34 percent from 9.78 percent earlier.
Well don’t pull the trigger too soon.
This week’s sharp swings in the Nifty and breach of midpoint of current three-digit Gann channel (i.e. 14,800) has thrown the cat among the pigeons. This disturbance has bought about a sharp decline in both Nifty breadth & NSE All Sector breadth i.e. around 26 percent stocks within the Nifty index are trading above 20-DMA and around 42 percent stocks across NSE ALL sectors are trading above 20-SMA, suggesting declining trend in the month of February.
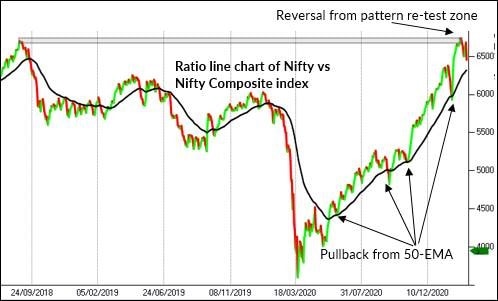
In such phase of chaos, it is important to monitor where the strength is flowing in i.e. equities or bonds? We have analysed ratio chart of Nifty versus Nifty GS composite index. The Nifty Composite G-sec Index is constructed using the prices of top 10 liquid Government of India bonds.
Ratio line shows a reversal from pattern re-test zone (i.e. peak of August 2018). Fall has been steep, yet it is trading above its 50-EMA. In the current uptrending phase, ratio has shown tendency to provide a pullback since June 2020 from the same moving average on numerous occasions.
Plotting the ratio of Nifty versus Nifty GS composite index on point & figure (P&F) chart shows a double bottom sell (column of O’s has broken below previous column of O’s), yet it continues to trade above support of 10 single column average (black line). Such double bottom sell set-ups have occurred earlier too, but downside has been short-lived. Pattern of double top buys & continuation follow through implies bias on the upside.
To conclude, ratio is reversing from pattern re-test zone, yet it is too early to confirm a reversal in trend of Equities’ outperformance against Nifty Composite Index (bonds). Once ratio starts reversing below the moving average, it would be considered a first sign of caution. While, move above pattern re-test zone would provide further fuel in equities’ outperformance.

Amid these confusion, few sectors are showing relative strength, wherein stock specific opportunities are likely to emerge going ahead (i.e. Nifty PSE, Energy, Smallcap, Midcap & Metal indices).
Disclaimer: The views and investment tips expressed by investment expert on Moneycontrol.com are his own and not that of the website or its management. Moneycontrol.com advises users to check with certified experts before taking any investment decisions.

Pritesh Mehta is a Lead Technical Analyst – Institutional Equities at YES Securities. He holds a Master’s degree from NMIMS. Prior to this assignment, he was associated with IIFL for 13 years as one of their lead technical analysts. His skills and forte include in-depth technical analysis and identifying actionable momentum trades. Pritesh excels in trend identification, with a special focus on inter-market analysis, gann & ratio charts.