Wall Street’s comeback story in U.S. housing finance has hinged on lending to self-employed borrowers and others who don’t quite fit the mold.
It financed millions of homes in recent years using alternative forms of documentation to gauge a borrower’s ability to afford a mortgage, sometimes at double the rates of interest as conventional mortgages.
But after a year of the pandemic, the small but important corner of housing finance referred to as the “non-qualified mortgage” (non-QM) segment has impairments that remain stubbornly high when compared with the rest of the U.S. housing market.
The non-QM rate of impairment hit 11.1% in February, the most recent data available for the sector, which was a 40-basis-point increase from a month prior, according to dv01, a platform that tracks consumer debt.
While that’s below a peak of 19.2% last June, the overall rate of U.S. home loans past due or in COVID-19 forbearance programs fell below 5% at the end of March.
“You really have self-employed borrowers struggling from day one,” said Vadim Verkhoglyad, an analyst at dv01, of the pandemic setting off a deluge of late payments and loan modifications.
“Investor loans struggle because so many tenants aren’t paying rent,” he said of another key area of stress.
Therein lies the hitch of the non-QM borrower, someone with good credit akin to Wall Street’s “Alt-A” category, before standards collapsed in the run-up to the 2008 global financial crisis. But instead of an imploding housing market, many borrowers now face the economic strain of the pandemic.
“It’s like a jungle,” said Caroline Chen, a senior research analyst at Income Research + Management in Boston, about the hodgepodge of loan types and borrowers in the non-QM group. “They all have some story behind them.”
“Some are self-employed borrowers who can’t provide full documentation,” Chen said, referring to the standard two years of W2s and tax returns often required for a conventional mortgage, as well as other proof of income, assets and debts.
Other non-QM borrowers have high debt levels relative to their income or planned to use a home as an investment property, rather than a primary residence.
Docs in spotlight
What has become clear a year into the COVID crisis is that certain types of borrowers have kept up on their mortgages better than others.
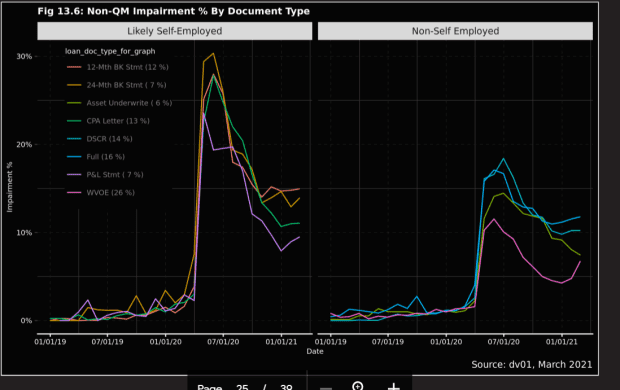
By far, loans originated using 12 to 24 months of bank statements, likely to a self-employed borrower, have been the worst-performing group of the non-QM group, per this dv01 chart.

Worst performers are bank statement loans
dv01
Loans that included a verification of income form, or (WVOI), typically from an employer, have performed the best.
Chen pointed out that lenders generally charged higher 6% to 7% rates of interest on non-QM home loans to help offset the higher default risks of borrowers. That also can mean higher returns for mortgage bond investors in the roughly $ 33.6 billion sector.
On the flip side, U.S. mortgages financed through housing giants Freddie Mac FMCC, , Fannie Mae FNMA, +1.03% or Ginnie Mae require full documentation, and come with lower returns for bondholders, but also government guarantees.
Borrowers eligible for conventional 30-year mortgages can still fetch rates as low as 3.17%, even as longer-dated Treasury yields TMUBMUSD10Y, 1.728% TMUBMUSD30Y, 2.386% have climbed about 1% from their one-year lows. Importantly, those homeowners also can qualify for federal pandemic mortgage-relief programs. Relief to borrowers with Wall Street-financed loans has been spottier.
Read: Door is shut to millions of American homeowners in need of mortgage relief as pandemic enters Year 2
Delinquency triggers
The U.S. housing market has been a bright spot for the economy, despite a still battered labor market and roughly 2.6 million homeowners in forbearance.
The most recent reading of the S&P CoreLogic Case-Shiller 20-city price index posted an 11.1% yearly gain in January, in part as households cramped by remote work have competed for larger homes outside of big cities.
Higher home prices have been a boon to the estimated $ 11.5 trillion pile of U.S. residential mortgage debt, the bulk of which has been financed through the housing agencies. Only about a 3.7% sliver was financed through the sale of private mortgage bonds without government guarantees, according to the Urban Institute.
Of the privately financed component, outstanding non-QM mortgage bonds were about 6% of the total as of late February, according to BofA Global Research.
Even so, there’s been a spotlight on borrowers financed by Wall Street in the aftermath of the 2008-2010 foreclosure crisis, which also reverberated globally and saddled investors in private mortgage bond deals with painful losses.
While loan losses have remained low in the non-QM segment so far, there were 19 mortgage-bond deals subject to loan delinquency triggers, per a March report from credit rating firm DBRS Morningstar, down from a peak of 24 last June.
Those triggers can be an early warning sign of losses to come, but on a practical level often cause cash flows to bondholders to become disrupted, until more cash starts flowing from increased monthly mortgage payments or loan resolutions, often as a result of a property sale or foreclosure.
The problem right now is that impairments in the non-QM sector have been running high, but it remains up to individual loan servicers to implement their own debt-relief programs.
“There is no industry standard,” said Chen, about how private loans are serviced during times of stress. “That’s the challenging part.”
