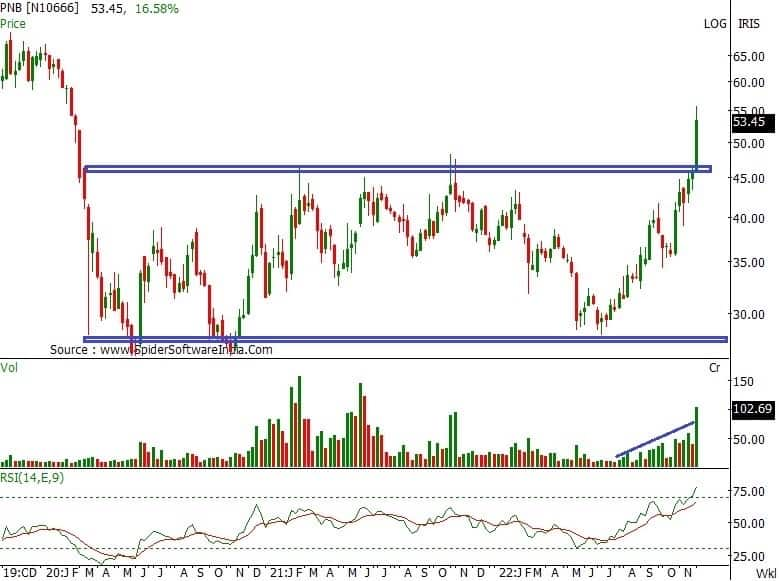
Punjab National Bank shares rallied more than 5 percent on November 25 to Rs 53.6, their highest closing since February 14, 2020, and formed a bullish candle on the daily charts
Sunil Shankar Matkar
November 28, 2022 / 06:18 AM IST

‘); $ (‘#lastUpdated_’+articleId).text(resData[stkKey][‘lastupdate’]); //if(resData[stkKey][‘percentchange’] > 0){ // $ (‘#greentxt_’+articleId).removeClass(“redtxt”).addClass(“greentxt”); // $ (‘.arw_red’).removeClass(“arw_red”).addClass(“arw_green”); //}else if(resData[stkKey][‘percentchange’] < 0){ // $ (‘#greentxt_’+articleId).removeClass(“greentxt”).addClass(“redtxt”); // $ (‘.arw_green’).removeClass(“arw_green”).addClass(“arw_red”); //} if(resData[stkKey][‘percentchange’] >= 0){ $ (‘#greentxt_’+articleId).removeClass(“redtxt”).addClass(“greentxt”); //$ (‘.arw_red’).removeClass(“arw_red”).addClass(“arw_green”); $ (‘#gainlosstxt_’+articleId).find(“.arw_red”).removeClass(“arw_red”).addClass(“arw_green”); }else if(resData[stkKey][‘percentchange’] < 0){ $ (‘#greentxt_’+articleId).removeClass(“greentxt”).addClass(“redtxt”); //$ (‘.arw_green’).removeClass(“arw_green”).addClass(“arw_red”); $ (‘#gainlosstxt_’+articleId).find(‘.arw_green’).removeClass(“arw_green”).addClass(“arw_red”); } $ (‘#volumetxt_’+articleId).show(); $ (‘#vlmtxt_’+articleId).show(); $ (‘#stkvol_’+articleId).text(resData[stkKey][‘volume’]); $ (‘#td-low_’+articleId).text(resData[stkKey][‘daylow’]); $ (‘#td-high_’+articleId).text(resData[stkKey][‘dayhigh’]); $ (‘#rightcol_’+articleId).show(); }else{ $ (‘#volumetxt_’+articleId).hide(); $ (‘#vlmtxt_’+articleId).hide(); $ (‘#stkvol_’+articleId).text(”); $ (‘#td-low_’+articleId).text(”); $ (‘#td-high_’+articleId).text(”); $ (‘#rightcol_’+articleId).hide(); } $ (‘#stk-graph_’+articleId).attr(‘src’,’//appfeeds.moneycontrol.com/jsonapi/stocks/graph&format=json&watch_app=true&range=1d&type=area&ex=’+stockType+’&sc_id=’+stockId+’&width=157&height=100&source=web’); } } } }); } $ (‘.bseliveselectbox’).click(function(){ $ (‘.bselivelist’).show(); }); function bindClicksForDropdown(articleId){ $ (‘ul#stockwidgettabs_’+articleId+’ li’).click(function(){ stkId = jQuery.trim($ (this).find(‘a’).attr(‘stkid’)); $ (‘ul#stockwidgettabs_’+articleId+’ li’).find(‘a’).removeClass(‘active’); $ (this).find(‘a’).addClass(‘active’); stockWidget(‘N’,stkId,articleId); }); $ (‘#stk-b-‘+articleId).click(function(){ stkId = jQuery.trim($ (this).attr(‘stkId’)); stockWidget(‘B’,stkId,articleId); $ (‘.bselivelist’).hide(); }); $ (‘#stk-n-‘+articleId).click(function(){ stkId = jQuery.trim($ (this).attr(‘stkId’)); stockWidget(‘N’,stkId,articleId); $ (‘.bselivelist’).hide(); }); } $ (“.bselivelist”).focusout(function(){ $ (“.bselivelist”).hide(); //hide the results }); function bindMenuClicks(articleId){ $ (‘#watchlist-‘+articleId).click(function(){ var stkId = $ (this).attr(‘stkId’); overlayPopupWatchlist(0,2,1,stkId); }); $ (‘#portfolio-‘+articleId).click(function(){ var dispId = $ (this).attr(‘dispId’); pcSavePort(0,1,dispId); }); } $ (‘.mc-modal-close’).on(‘click’,function(){ $ (‘.mc-modal-wrap’).css(‘display’,’none’); $ (‘.mc-modal’).removeClass(‘success’); $ (‘.mc-modal’).removeClass(‘error’); }); function overlayPopupWatchlist(e, t, n,stkId) { $ (‘.srch_bx’).css(‘z-index’,’999′); typparam1 = n; if(readCookie(‘nnmc’)) { var lastRsrs =new Array(); lastRsrs[e]= stkId; if(lastRsrs.length > 0) { var resStr=”; var url = ‘//www.moneycontrol.com/mccode/common/saveWatchlist.php’; $ .get( “//www.moneycontrol.com/mccode/common/rhsdata.html”, function( data ) { $ (‘#backInner1_rhsPop’).html(data); $ .ajax({url:url, type:”POST”, dataType:”json”, data:{q_f:typparam1,wSec:secglbVar,wArray:lastRsrs}, success:function(d) { if(typparam1==’1′) // rhs { var appndStr=”; var newappndStr = makeMiddleRDivNew(d); appndStr = newappndStr[0]; var titStr=”;var editw=”; var typevar=”; var pparr= new Array(‘Monitoring your investments regularly is important.’,’Add your transaction details to monitor your stock`s performance.’,’You can also track your Transaction History and Capital Gains.’); var phead =’Why add to Portfolio?’; if(secglbVar ==1) { var stkdtxt=’this stock’; var fltxt=’ it ‘; typevar =’Stock ‘; if(lastRsrs.length>1){ stkdtxt=’these stocks’; typevar =’Stocks ‘;fltxt=’ them ‘; } } //var popretStr =lvPOPRHS(phead,pparr); //$ (‘#poprhsAdd’).html(popretStr); //$ (‘.btmbgnwr’).show(); var tickTxt =’‘; if(typparam1==1) { var modalContent = ‘Watchlist has been updated successfully.’; var modalStatus = ‘success’; //if error, use ‘error’ $ (‘.mc-modal-content’).text(modalContent); $ (‘.mc-modal-wrap’).css(‘display’,’flex’); $ (‘.mc-modal’).addClass(modalStatus); //var existsFlag=$ .inArray(‘added’,newappndStr[1]); //$ (‘#toptitleTXT’).html(tickTxt+typevar+’ to your watchlist’); //if(existsFlag == -1) //{ // if(lastRsrs.length > 1) // $ (‘#toptitleTXT’).html(tickTxt+typevar+’already exist in your watchlist’); // else // $ (‘#toptitleTXT’).html(tickTxt+typevar+’already exists in your watchlist’); // //} } //$ (‘.accdiv’).html(”); //$ (‘.accdiv’).html(appndStr); } }, //complete:function(d){ // if(typparam1==1) // { // watchlist_popup(‘open’); // } //} }); }); } else { var disNam =’stock’; if($ (‘#impact_option’).html()==’STOCKS’) disNam =’stock’; if($ (‘#impact_option’).html()==’MUTUAL FUNDS’) disNam =’mutual fund’; if($ (‘#impact_option’).html()==’COMMODITIES’) disNam =’commodity’; alert(‘Please select at least one ‘+disNam); } } else { AFTERLOGINCALLBACK = ‘overlayPopup(‘+e+’, ‘+t+’, ‘+n+’)’; commonPopRHS(); /*work_div = 1; typparam = t; typparam1 = n; check_login_pop(1)*/ } } function pcSavePort(param,call_pg,dispId) { var adtxt=”; if(readCookie(‘nnmc’)){ if(call_pg == “2”) { pass_sec = 2; } else { pass_sec = 1; } var url = ‘//www.moneycontrol.com/mccode/common/saveWatchlist.php’; $ .ajax({url:url, type:”POST”, //data:{q_f:3,wSec:1,dispid:$ (‘input[name=sc_dispid_port]’).val()}, data:{q_f:3,wSec:pass_sec,dispid:dispId}, dataType:”json”, success:function(d) { //var accStr= ”; //$ .each(d.ac,function(i,v) //{ // accStr+=”+v.nm+”; //}); $ .each(d.data,function(i,v) { if(v.flg == ‘0’) { var modalContent = ‘Scheme added to your portfolio.’; var modalStatus = ‘success’; //if error, use ‘error’ $ (‘.mc-modal-content’).text(modalContent); $ (‘.mc-modal-wrap’).css(‘display’,’flex’); $ (‘.mc-modal’).addClass(modalStatus); //$ (‘#acc_sel_port’).html(accStr); //$ (‘#mcpcp_addportfolio .form_field, .form_btn’).removeClass(‘disabled’); //$ (‘#mcpcp_addportfolio .form_field input, .form_field select, .form_btn input’).attr(‘disabled’, false); // //if(call_pg == “2”) //{ // adtxt =’ Scheme added to your portfolio We recommend you add transactional details to evaluate your investment better. x‘; //} //else //{ // adtxt =’ Stock added to your portfolio We recommend you add transactional details to evaluate your investment better. x‘; //} //$ (‘#mcpcp_addprof_info’).css(‘background-color’,’#eeffc8′); //$ (‘#mcpcp_addprof_info’).html(adtxt); //$ (‘#mcpcp_addprof_info’).show(); glbbid=v.id; } }); } }); } else { AFTERLOGINCALLBACK = ‘pcSavePort(‘+param+’, ‘+call_pg+’, ‘+dispId+’)’; commonPopRHS(); /*work_div = 1; typparam = t; typparam1 = n; check_login_pop(1)*/ } } function commonPopRHS(e) { /*var t = ($ (window).height() – $ (“#” + e).height()) / 2 + $ (window).scrollTop(); var n = ($ (window).width() – $ (“#” + e).width()) / 2 + $ (window).scrollLeft(); $ (“#” + e).css({ position: “absolute”, top: t, left: n }); $ (“#lightbox_cb,#” + e).fadeIn(300); $ (“#lightbox_cb”).remove(); $ (“body”).append(”); $ (“#lightbox_cb”).css({ filter: “alpha(opacity=80)” }).fadeIn()*/ $ (“#myframe”).attr(‘src’,’https://accounts.moneycontrol.com/mclogin/?d=2′); $ (“#LoginModal”).modal(); } function overlay(n) { document.getElementById(‘back’).style.width = document.body.clientWidth + “px”; document.getElementById(‘back’).style.height = document.body.clientHeight +”px”; document.getElementById(‘back’).style.display = ‘block’; jQuery.fn.center = function () { this.css(“position”,”absolute”); var topPos = ($ (window).height() – this.height() ) / 2; this.css(“top”, -topPos).show().animate({‘top’:topPos},300); this.css(“left”, ( $ (window).width() – this.width() ) / 2); return this; } setTimeout(function(){$ (‘#backInner’+n).center()},100); } function closeoverlay(n){ document.getElementById(‘back’).style.display = ‘none’; document.getElementById(‘backInner’+n).style.display = ‘none’; } stk_str=”; stk.forEach(function (stkData,index){ if(index==0){ stk_str+=stkData.stockId.trim(); }else{ stk_str+=’,’+stkData.stockId.trim(); } }); $ .get(‘//www.moneycontrol.com/techmvc/mc_apis/stock_details/?sc_id=’+stk_str, function(data) { stk.forEach(function (stkData,index){ $ (‘#stock-name-‘+stkData.stockId.trim()+’-‘+article_id).text(data[stkData.stockId.trim()][‘nse’][‘shortname’]); }); }); function redirectToTradeOpenDematAccountOnline(){ if (stock_isinid && stock_tradeType) { window.open(`https://www.moneycontrol.com/open-demat-account-online?classic=true&script_id=$ {stock_isinid}&ex=$ {stock_tradeType}&site=web&asset_class=stock&utm_source=moneycontrol&utm_medium=articlepage&utm_campaign=tradenow&utm_content=webbutton`, ‘_blank’); } }
The December series got off to a quiet start with the market closing a tad higher on November 25 after a day of big moves. The gains, however, were enough to see the benchmark indices close at record highs, with the Sensex rising 21 points to 62,294 and the Nifty 29 points to 18,513.
For the week, the benchmarks indices gained more than a percent amid suggestions of the US Federal Reserve slowing the pace of interest rate hikes.
The Nifty formed a Doji pattern on the daily charts and a bullish candle on the weekly scale.
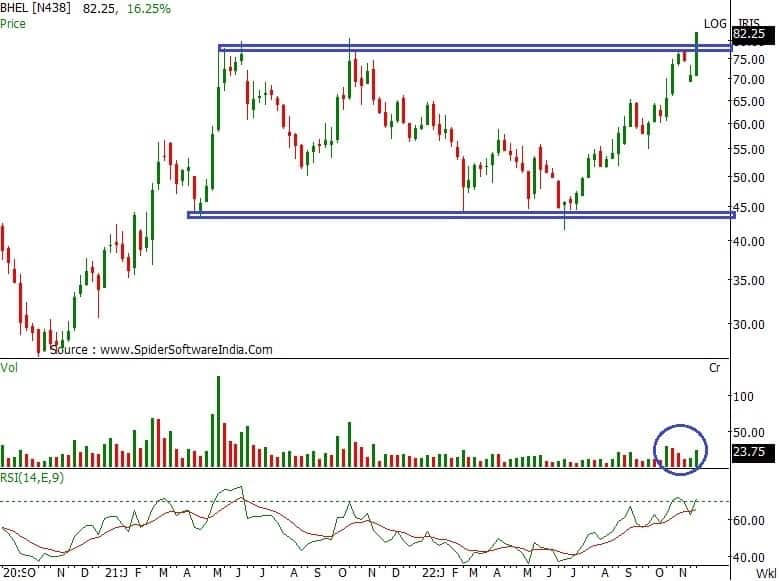
Stocks that were in action and performed better than broader markets included BHEL, the second biggest gainer in the futures & options segment that rose 9.6 percent to Rs 81.95. Its highest closing since May 31, 2018 saw the stock form a robust bullish candle on the daily charts.
Punjab National Bank shares rallied more than 5 percent to Rs 53.6, the highest closing since February 14, 2020 and formed bullish candle on the daily charts as it formed higher highs higher lows for the sixth consecutive session.
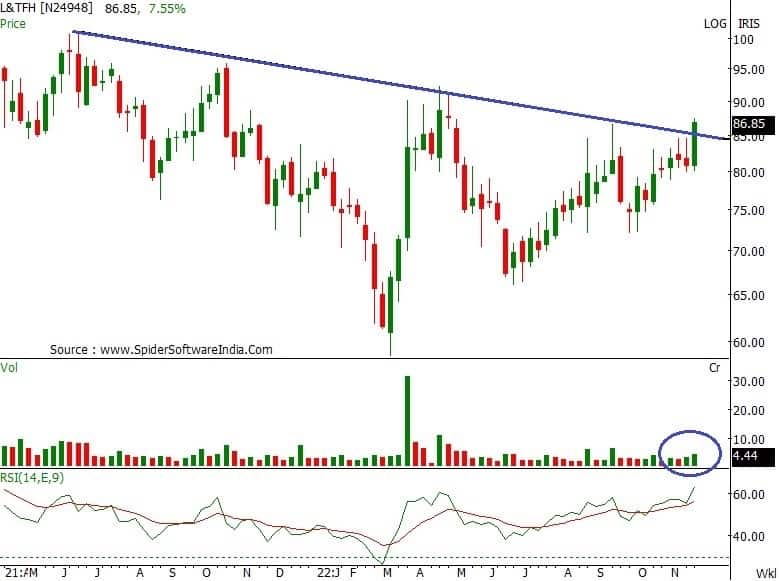
L&T Finance Holdings gained 5.5 percent to Rs 86.90 and formed a long bullish candle on the daily charts with above average volumes, making higher highs and higher lows for the fourth straight session. It also saw a breakout of the horizontal trend line adjoining April 8, May 4 and September 16 this year.
Here’s what Rajesh Palviya of Axis Securities recommends investors should do with these stocks when the market resumes trading today:
Bharat Heavy Electricals
With a strong up move on November 25, the stock has decisively broken out of its “multi-year resistance” zone of Rs 79 on a weekly closing basis. The breakout was accompanied by huge volumes representing increased participation at the breakout zone.
The stock is firmly placed above its 20, 50, 100, 200-day simple moving averages (SMAs), which reconfirms bullish sentiments.
The daily, weekly, monthly strength indicator the relative strength index (RSI) is in a bullish mode and holding above the 50 mark, indicating sustained strength across all time frames.
Investors should buy, hold and accumulate the stock with an expected upside of Rs 95-105, with downside support zone of Rs 75-70.
Punjab National Bank
Since February 2020, the stock was consolidating within a broad range of Rs 48-28, indicating accumulation at lower levels but a strong breakout above Rs 48 in the previous week resulted in a trend reversal.
For the past five to six months, the steady and gradual increase in volumes represents increased participation at lower levels. The weekly and monthly “band Bollinger” buy signals suggest increased momentum.
The daily, weekly and monthly RSI is in positive terrain, which indicates rising strength.
Investors should buy, hold and accumulate this stock with an expected upside of Rs 63-70, with a downside support zone of Rs 50-45 levels.
L&T Finance Holdings
On the weekly time frame, the stock has confirmed the past two years’ “down-sloping” trendline breakout at Rs 84 on a weekly closing basis showing trend reversal on the weekly time frame. This breakout is accompanied by huge volumes representing increased participation.
The stock is well placed above its 20, 50, 100 and 200-day SMAs, which reconfirm bullish sentiments. The daily, weekly and monthly strength indicator RSI is in positive terrain which indicates rising strength.
Investors should buy, hold and accumulate this stock with an expected upside of Rs 96-105, with a downside support zone of Rs 80-78.
Disclaimer: The views and investment tips expressed by experts on Moneycontrol.com are their own and not those of the website or its management. Moneycontrol.com advises users to check with certified experts before taking any investment decisions.