Rajesh Palviya of Axis Securities
Bharti Airtel is on a strong foothold as the stock has been trading at around the upper zone of band Bollinger but the real move is yet to be seen, says Rajesh Palviya of Axis Securities.
The Airtel price move is currently getting rejected near upper band and retraces back to neckline and takes support to rebound, he adds.
The vice-president of research and head of technical and derivatives at Axis Securities with over 20 years of professional experience in the financial services industry believes the Nifty Midcap 100 will hit 35,000 mark.
“Technically apart from trading above the important 200 DMA (daily moving average) and other momentum oscillators – volume indicators, if we draw retracement from the recent high-low then the first target comes at 35,000 and sustain above the same then the next target comes at 37,000,” he shares in an interview to Moneycontrol.
Excerpts from the interview:
The market has not been getting enough strength to get back to 18,000 mark. Do you see any possibility of the market getting back to 16,000 mark in the short term, though there seems to be positive trend in medium term?
Global markets witnessed a sell-off as monthly non-farm payrolls data stronger-than-expected subdued hopes of a Fed pivot, and shifted investor focus to the prospect of another jumbo-sized rate hike next month will lead to a recession. In the very near term, there are uncertainties around US inflation, interest rates, recession in large economies and commodity prices. Developments around these factors will keep markets volatile.
The Nifty had last week witnessed a strong rebound from 100-day SMA (simple moving average – 16,727) and reclaimed the 17,000 psychological mark on a closing basis. Index has ended its corrective phase at around 50 percent Fibonacci retracement (16,640) of prior up-move (15,183-18,096).
Though market move is getting rejected in short term on the higher zone but on the downside also market is holding with strength near 16,800 – 17,000 zone & until we don’t drawdown below 16,800 mark lower side level are unlikely to be tested.
Market may witness major unwinding action below 16,800, while on the other hand if we manage to close above 17,450 level we may see a strike through 18,000 mark again. The weekly strength indicator RSI (relative strength index) is at the verge of crossover above its reference line indicating trend may change to positive.
The IT index has seen two strong gap-up openings in the start of the current month after falling closer to the 26,000 mark. Do you think the sector has bottomed out and gradually preparing ground to make a big move in the coming months?
In an aggressive rate hike by the US Federal Reserve scenario, the rupee will have weakening bias against USD. We have seen in the past that in times of currency depreciation, export-oriented sector like IT stand out in terms of price performance relative to market but in near term fear of recession in large economies IT sector is in defensive in nature and market attributing benefits of currency depreciation to earnings.
Ideally, the IT sector index on falling back towards 26,000 zone has marked a kind of double bottom level on the lower side and have rebounded back towards 28,000 levels. If we sense slightly on the broader scale we think reclaim above 28,000 zone can confirm sector is bottoming out & we may see an move towards 29,500 – 30,000 levels.
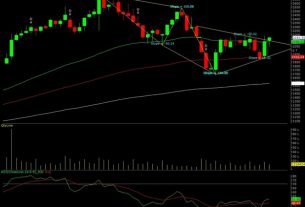
As per technical charts, do you see the Indian rupee weakening towards 85 against the US dollar soon?
On the monthly chart, prices have consecutively closed in positive for the last nine months and historically similar moves happened from February 2018 to October 2018 where the pair rallied from 65.30 to 74.50 almost a 17 percent rise.
The pair have rallied from a low of 74.30 (February 2022) – up 11 percent to the current price of 82.82. So if according to the technical theory of “history repeats itself” we could see prices rallying further 6 percent which comes around 86.50, which also coincides with the Fibonacci extension levels of 161.80 percent (drawn using three reference points low 68.28, high 77.01 and low 72.26) which stands at 86.60.
For the above observation we can say the pair could test 85 levels on the charts but the time horizon could be a few weeks or may be months to come. However if USDINR breaks below 81.50 then it may correct further towards 81.20- 80.55 levels.
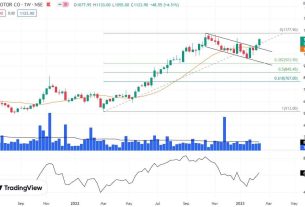
Do you think Bharti Airtel is on a strong footing now as it has largely been trading in the upper Bollinger Band since August?
Bharti Airtel is on a strong foothold as stock has been trading at around upper zone of band Bollinger but the real move is still to be seen into the stock. If we keenly observe price move is currently getting rejected near upper band & retraces back to neckline and take support to rebound.
The stock has retraced from the upper band and is trading near the support zone (neckline) of Rs 780. Going ahead, if we close below Rs 770, then we may reclaim lower band Bollinger zone which is place near Rs 740 zone. While if support holds, we may see an strong rebound and probable move above Rs 800 will confirm the outbreak of upper band Bollinger zone in short term and we can see rally towards Rs 840-860 in short term.
After a year-long consolidation, is the Nifty Midcap 100 index ready to hit 35,000 mark by end of current financial year?
The Nifty Midcap has made a strong bullish monthly chart and is currently trading almost near 4-month high augmented with momentum oscillator RSI above 60 levels and increasing volumes indicating overall uptrend in index along with positive bias to continue.
So, to answer the question whether Nifty Midcap 100 will hit 35000 mark, the answer is yes. Technically, apart from trading above the important 200 DMA (daily moving average) and other momentum oscillators – volume indicators, if we draw retracement from the recent high-low then the first target comes at 35,000 & sustain above the same then the next target comes at 37,000.
However any close below 27,800 – 27,700 on monthly chart will be a negative signal for the current trend and will negate the above view.
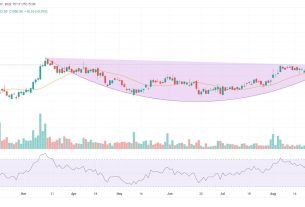
After taking multiple supports above 12,000 mark, do you think Nifty Pharma has enough strength now to surpass 14,000 by calendar year-end?
The Nifty pharma is showing buying interest at lower levels and managed to give breakout of last four-month consolidation range breakout.
Pharma index managed to give breakout of falling trend line on weekly chart indicates trend reversal. Chart pattern indicates if Pharma index manages to hold above 12,800-12,700 levels then it may scale up towards 13,500-14,000 levels in coming months.
Disclaimer: The views and investment tips expressed by investment experts on Moneycontrol.com are their own and not those of the website or its management. Moneycontrol.com advises users to check with certified experts before taking any investment decisions.