SRF has breached the crucial support of its 200 days EMA and closed below that for two consecutive sessions. Stock price has broken below from Bearish Head and Shoulder pattern on the daily charts. The monthly relative strength index (RSI) has exited the overbought zone with negative divergence.
Vinay Rajani
June 21, 2022 / 07:04 AM IST

‘); $ (‘#lastUpdated_’+articleId).text(resData[stkKey][‘lastupdate’]); //if(resData[stkKey][‘percentchange’] > 0){ // $ (‘#greentxt_’+articleId).removeClass(“redtxt”).addClass(“greentxt”); // $ (‘.arw_red’).removeClass(“arw_red”).addClass(“arw_green”); //}else if(resData[stkKey][‘percentchange’] < 0){ // $ (‘#greentxt_’+articleId).removeClass(“greentxt”).addClass(“redtxt”); // $ (‘.arw_green’).removeClass(“arw_green”).addClass(“arw_red”); //} if(resData[stkKey][‘percentchange’] >= 0){ $ (‘#greentxt_’+articleId).removeClass(“redtxt”).addClass(“greentxt”); //$ (‘.arw_red’).removeClass(“arw_red”).addClass(“arw_green”); $ (‘#gainlosstxt_’+articleId).find(“.arw_red”).removeClass(“arw_red”).addClass(“arw_green”); }else if(resData[stkKey][‘percentchange’] < 0){ $ (‘#greentxt_’+articleId).removeClass(“greentxt”).addClass(“redtxt”); //$ (‘.arw_green’).removeClass(“arw_green”).addClass(“arw_red”); $ (‘#gainlosstxt_’+articleId).find(‘.arw_green’).removeClass(“arw_green”).addClass(“arw_red”); } $ (‘#volumetxt_’+articleId).show(); $ (‘#vlmtxt_’+articleId).show(); $ (‘#stkvol_’+articleId).text(resData[stkKey][‘volume’]); $ (‘#td-low_’+articleId).text(resData[stkKey][‘daylow’]); $ (‘#td-high_’+articleId).text(resData[stkKey][‘dayhigh’]); $ (‘#rightcol_’+articleId).show(); }else{ $ (‘#volumetxt_’+articleId).hide(); $ (‘#vlmtxt_’+articleId).hide(); $ (‘#stkvol_’+articleId).text(”); $ (‘#td-low_’+articleId).text(”); $ (‘#td-high_’+articleId).text(”); $ (‘#rightcol_’+articleId).hide(); } $ (‘#stk-graph_’+articleId).attr(‘src’,’//appfeeds.moneycontrol.com/jsonapi/stocks/graph&format=json&watch_app=true&range=1d&type=area&ex=’+stockType+’&sc_id=’+stockId+’&width=157&height=100&source=web’); } } } }); } $ (‘.bseliveselectbox’).click(function(){ $ (‘.bselivelist’).show(); }); function bindClicksForDropdown(articleId){ $ (‘ul#stockwidgettabs_’+articleId+’ li’).click(function(){ stkId = jQuery.trim($ (this).find(‘a’).attr(‘stkid’)); $ (‘ul#stockwidgettabs_’+articleId+’ li’).find(‘a’).removeClass(‘active’); $ (this).find(‘a’).addClass(‘active’); stockWidget(‘N’,stkId,articleId); }); $ (‘#stk-b-‘+articleId).click(function(){ stkId = jQuery.trim($ (this).attr(‘stkId’)); stockWidget(‘B’,stkId,articleId); $ (‘.bselivelist’).hide(); }); $ (‘#stk-n-‘+articleId).click(function(){ stkId = jQuery.trim($ (this).attr(‘stkId’)); stockWidget(‘N’,stkId,articleId); $ (‘.bselivelist’).hide(); }); } $ (“.bselivelist”).focusout(function(){ $ (“.bselivelist”).hide(); //hide the results }); function bindMenuClicks(articleId){ $ (‘#watchlist-‘+articleId).click(function(){ var stkId = $ (this).attr(‘stkId’); overlayPopupWatchlist(0,2,1,stkId); }); $ (‘#portfolio-‘+articleId).click(function(){ var dispId = $ (this).attr(‘dispId’); pcSavePort(0,1,dispId); }); } $ (‘.mc-modal-close’).on(‘click’,function(){ $ (‘.mc-modal-wrap’).css(‘display’,’none’); $ (‘.mc-modal’).removeClass(‘success’); $ (‘.mc-modal’).removeClass(‘error’); }); function overlayPopupWatchlist(e, t, n,stkId) { $ (‘.srch_bx’).css(‘z-index’,’999′); typparam1 = n; if(readCookie(‘nnmc’)) { var lastRsrs =new Array(); lastRsrs[e]= stkId; if(lastRsrs.length > 0) { var resStr=”; var url = ‘//www.moneycontrol.com/mccode/common/saveWatchlist.php’; $ .get( “//www.moneycontrol.com/mccode/common/rhsdata.html”, function( data ) { $ (‘#backInner1_rhsPop’).html(data); $ .ajax({url:url, type:”POST”, dataType:”json”, data:{q_f:typparam1,wSec:secglbVar,wArray:lastRsrs}, success:function(d) { if(typparam1==’1′) // rhs { var appndStr=”; var newappndStr = makeMiddleRDivNew(d); appndStr = newappndStr[0]; var titStr=”;var editw=”; var typevar=”; var pparr= new Array(‘Monitoring your investments regularly is important.’,’Add your transaction details to monitor your stock`s performance.’,’You can also track your Transaction History and Capital Gains.’); var phead =’Why add to Portfolio?’; if(secglbVar ==1) { var stkdtxt=’this stock’; var fltxt=’ it ‘; typevar =’Stock ‘; if(lastRsrs.length>1){ stkdtxt=’these stocks’; typevar =’Stocks ‘;fltxt=’ them ‘; } } //var popretStr =lvPOPRHS(phead,pparr); //$ (‘#poprhsAdd’).html(popretStr); //$ (‘.btmbgnwr’).show(); var tickTxt =’‘; if(typparam1==1) { var modalContent = ‘Watchlist has been updated successfully.’; var modalStatus = ‘success’; //if error, use ‘error’ $ (‘.mc-modal-content’).text(modalContent); $ (‘.mc-modal-wrap’).css(‘display’,’flex’); $ (‘.mc-modal’).addClass(modalStatus); //var existsFlag=$ .inArray(‘added’,newappndStr[1]); //$ (‘#toptitleTXT’).html(tickTxt+typevar+’ to your watchlist’); //if(existsFlag == -1) //{ // if(lastRsrs.length > 1) // $ (‘#toptitleTXT’).html(tickTxt+typevar+’already exist in your watchlist’); // else // $ (‘#toptitleTXT’).html(tickTxt+typevar+’already exists in your watchlist’); // //} } //$ (‘.accdiv’).html(”); //$ (‘.accdiv’).html(appndStr); } }, //complete:function(d){ // if(typparam1==1) // { // watchlist_popup(‘open’); // } //} }); }); } else { var disNam =’stock’; if($ (‘#impact_option’).html()==’STOCKS’) disNam =’stock’; if($ (‘#impact_option’).html()==’MUTUAL FUNDS’) disNam =’mutual fund’; if($ (‘#impact_option’).html()==’COMMODITIES’) disNam =’commodity’; alert(‘Please select at least one ‘+disNam); } } else { AFTERLOGINCALLBACK = ‘overlayPopup(‘+e+’, ‘+t+’, ‘+n+’)’; commonPopRHS(); /*work_div = 1; typparam = t; typparam1 = n; check_login_pop(1)*/ } } function pcSavePort(param,call_pg,dispId) { var adtxt=”; if(readCookie(‘nnmc’)){ if(call_pg == “2”) { pass_sec = 2; } else { pass_sec = 1; } var url = ‘//www.moneycontrol.com/mccode/common/saveWatchlist.php’; $ .ajax({url:url, type:”POST”, //data:{q_f:3,wSec:1,dispid:$ (‘input[name=sc_dispid_port]’).val()}, data:{q_f:3,wSec:pass_sec,dispid:dispId}, dataType:”json”, success:function(d) { //var accStr= ”; //$ .each(d.ac,function(i,v) //{ // accStr+=”+v.nm+”; //}); $ .each(d.data,function(i,v) { if(v.flg == ‘0’) { var modalContent = ‘Scheme added to your portfolio.’; var modalStatus = ‘success’; //if error, use ‘error’ $ (‘.mc-modal-content’).text(modalContent); $ (‘.mc-modal-wrap’).css(‘display’,’flex’); $ (‘.mc-modal’).addClass(modalStatus); //$ (‘#acc_sel_port’).html(accStr); //$ (‘#mcpcp_addportfolio .form_field, .form_btn’).removeClass(‘disabled’); //$ (‘#mcpcp_addportfolio .form_field input, .form_field select, .form_btn input’).attr(‘disabled’, false); // //if(call_pg == “2”) //{ // adtxt =’ Scheme added to your portfolio We recommend you add transactional details to evaluate your investment better. x‘; //} //else //{ // adtxt =’ Stock added to your portfolio We recommend you add transactional details to evaluate your investment better. x‘; //} //$ (‘#mcpcp_addprof_info’).css(‘background-color’,’#eeffc8′); //$ (‘#mcpcp_addprof_info’).html(adtxt); //$ (‘#mcpcp_addprof_info’).show(); glbbid=v.id; } }); } }); } else { AFTERLOGINCALLBACK = ‘pcSavePort(‘+param+’, ‘+call_pg+’, ‘+dispId+’)’; commonPopRHS(); /*work_div = 1; typparam = t; typparam1 = n; check_login_pop(1)*/ } } function commonPopRHS(e) { /*var t = ($ (window).height() – $ (“#” + e).height()) / 2 + $ (window).scrollTop(); var n = ($ (window).width() – $ (“#” + e).width()) / 2 + $ (window).scrollLeft(); $ (“#” + e).css({ position: “absolute”, top: t, left: n }); $ (“#lightbox_cb,#” + e).fadeIn(300); $ (“#lightbox_cb”).remove(); $ (“body”).append(”); $ (“#lightbox_cb”).css({ filter: “alpha(opacity=80)” }).fadeIn()*/ $ (“#myframe”).attr(‘src’,’https://accounts.moneycontrol.com/mclogin/?d=2′); $ (“#LoginModal”).modal(); } function overlay(n) { document.getElementById(‘back’).style.width = document.body.clientWidth + “px”; document.getElementById(‘back’).style.height = document.body.clientHeight +”px”; document.getElementById(‘back’).style.display = ‘block’; jQuery.fn.center = function () { this.css(“position”,”absolute”); var topPos = ($ (window).height() – this.height() ) / 2; this.css(“top”, -topPos).show().animate({‘top’:topPos},300); this.css(“left”, ( $ (window).width() – this.width() ) / 2); return this; } setTimeout(function(){$ (‘#backInner’+n).center()},100); } function closeoverlay(n){ document.getElementById(‘back’).style.display = ‘none’; document.getElementById(‘backInner’+n).style.display = ‘none’; } stk_str=”; stk.forEach(function (stkData,index){ if(index==0){ stk_str+=stkData.stockId.trim(); }else{ stk_str+=’,’+stkData.stockId.trim(); } }); $ .get(‘//www.moneycontrol.com/techmvc/mc_apis/stock_details/?sc_id=’+stk_str, function(data) { stk.forEach(function (stkData,index){ $ (‘#stock-name-‘+stkData.stockId.trim()+’-‘+article_id).text(data[stkData.stockId.trim()][‘nse’][‘shortname’]); }); });
Vinay Rajani, Senior Technical and Derivative Analyst at HDFC Securities
For the last two trading sessions, the Nifty50 has been finding support around 15,190 levels. The Nifty has formed a double bottom at 15,190 odd levels and ended with ‘Doji’ candlestick pattern on the daily charts. Daily RSI from the Nifty has just turned up from the oversold zone. However, the primary trend of the index is bearish, as it has been trading below 20, 50, 100 and 200 daily moving averages (DMA).
The Nifty has also been holding the lower top and lower bottom formations on the weekly charts. Nifty registered a fresh breakdown when it breached the 15,750 levels. In case of pullback, previous support of 15,750 is expected to interchange its role as resistance.
One of the breadth indicators that we have been tracking is the number of stocks above their 200 DMA. Presently, 14 percent of the NSE500 stocks are trading above 200 DMA. This number has reached its lower band as we saw breadth bottoming out once the number reached 13-14 percent in history. During 2016 and 2018, the market bottomed out when the number of stocks above 200 DMA reached 14 percent. This indicator has acted as a trend reversal signal in history and the same should be closely tracked.
Considering the technical evidence discussed above, we believe that pullbacks are part of bearish markets. If Nifty manages to hold above 15,190 levels, then there are good chances that it could show a pullback rally towards 15,700. However, considering the overall trend, rallies should be utilized to lighten long commitment. Below 15,190, Nifty could slide towards the next supports of 14,800 and 14,366 levels.
Here is one buy call and two sell calls for next 2-3 weeks:
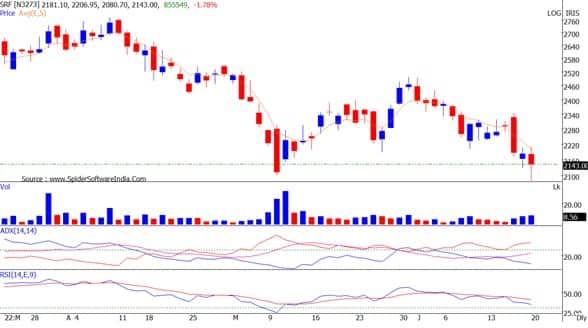
SRF: Sell | LTP: Rs 2,135.6 | Stop-Loss: Rs 2,242 | Target: Rs 1,985-1,910 | Return: 7-10 percent
The stock has breached the crucial support of its 200 days exponential moving average (EMA) and closed below that for two consecutive sessions. Stock price has broken below from Bearish Head and Shoulder pattern on the daily charts. The monthly relative strength index (RSI) has exited the overbought zone with negative divergence.
The stock is on the verge of breaking the consolidation which held for the last 6 months. Indicators and oscillators have turned bearish on daily and weekly charts. We recommend selling SRF in two tranches at current market price and second at Rs 2,200, for the target of Rs 1,985 and Rs 1,910, keeping a stop-loss at Rs 2,242.
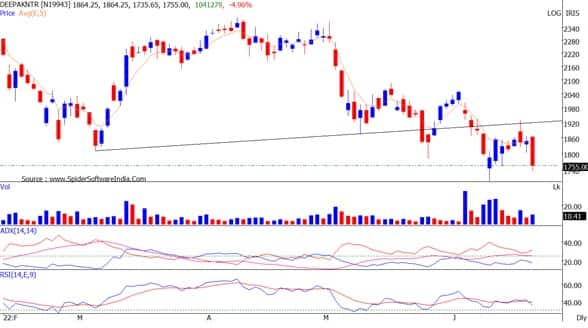
Deepak Nitrite: Sell | LTP: Rs 1,754 | Stop-Loss: Rs 1,841 | Targets: Rs 1,631-1,570 | Return: 7-10 percent
The stock has been forming lower tops and lower bottoms on the daily charts. Stock is placed below its 20, 50, 100 and 200 daily moving average (DMA). It broke down below the bearish “Flag” pattern on the daily charts.
Chemical companies have started underperforming the benchmark index. We recommend selling Deepak Nitrite in two tranches – one at current market price and second at Rs 1,810, for the targets of Rs 1,631 and Rs 1,570, keeping a stop-loss at Rs 1,841.
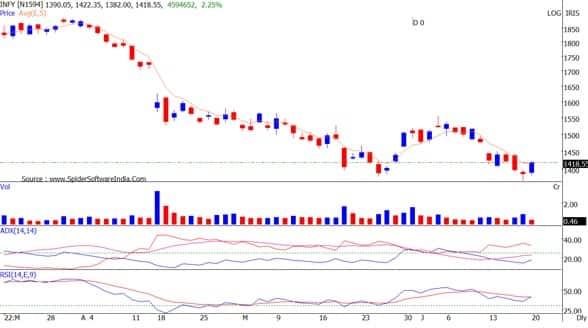
Infosys: Buy | LTP: Rs 1,414 | Stop-Loss: Rs 1,343 | Targets: Rs 1,513-1,590 | Return: 7-12 percent
On June 20, 2022, the stock outperformed the benchmark index and crossed its 5 days EMA intraday. RSI has also been moving up with positive divergence on the daily chart.
Nifty IT index looks extremely oversold on the short-term chart. A pullback rally can not be ruled out from current levels in Nifty IT Index. We recommend buying Infosys in two tranches – one at current market price and second at Rs 1,365, for the targets of Rs 1,513 and Rs 1,590, keeping stop-loss at Rs 1,343.
Disclaimer: The views and investment tips expressed by investment experts on Moneycontrol.com are their own and not those of the website or its management. Moneycontrol.com advises users to check with certified experts before taking any investment decisions.