Blink and you missed it, but the yield on the 2-year Treasury note traded briefly above the yield on the 10-year note Tuesday afternoon, temporarily inverting the yield curve and triggering recession warning bells.
So how worried should stock-market investors be?
Data shows that it hasn’t paid in the past to abandon stocks the moment the Treasury yield curve turns upside down, with short term yields higher than longer term yields.
Not a good timing tool
“While a good indicator of future economic woes, an inverted yield curve has not been a very good timing tool for equity investors,” wrote Brian Levitt, global market strategist at Invesco in a March 24 note.
See: A key part of the Treasury yield curve has finally inverted, setting off recession warning — here’s what investors need to know
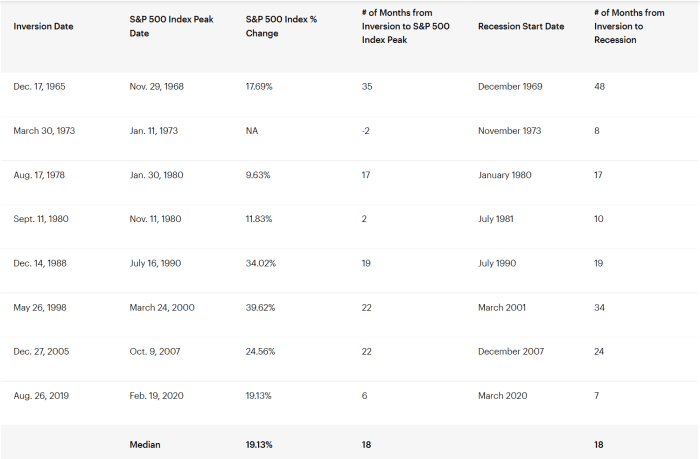
“For example, investors who sold when the yield curve first inverted on Dec. 14, 1988, missed a subsequent 34% gain in the S&P 500 index,” Levitt wrote. “Those who sold when it happened again on May 26, 1998, missed out on 39% additional upside to the market,” he said. “In fact, the median return of the S&P 500 index from the date in each cycle when the yield curve inverts to the market peak is 19%.” (See table below.)
Invesco
Investors certainly didn’t head for the hills Tuesday. U.S. stocks ended with strong gains, building on a bounce from early March lows and even propelling the S&P 500 SPX, +1.23% to an exit from the market correction it entered in February. The Dow Jones Industrial Average DJIA, +0.97% jumped 338 points, or 1%, while the Nasdaq Composite COMP, +1.84% advanced 1.8%.
Read: S&P 500 exits correction: Here’s what history says happens next to U.S. stock-market benchmark
Inversions and what they mean
Normally the yield curve, a line that measures the yields across all maturities, slopes upward given the time value of money. An inversion of the curve signals that investors expect longer term rates to be below near-term rates, a phenomenon widely taken as a signal of a potential economic downturn.
But there’s a lag there, too. Levitt noted that the data, going back to 1965, show the median length of time between an inversion and a recession has been 18 months — matching the median stretch between the onset of an inversion and an S&P 500 peak.
Moreover, researchers have argued that a persistent inversion is necessary to send a signal, something that hasn’t occurred yet, but remains widely expected.
Which curve?
An inversion of the 2-year TMUBMUSD02Y, 2.338% /10-year TMUBMUSD10Y, 2.368% measure of the yield curve has preceded all six recessions since 1978, with just one false positive, said Ross Mayfield, investment strategy analyst at Baird, in a Monday note.
But the 3-month/10-year spread is seen as even, if only slightly, more reliable and has been more popular among academics, noted researchers at the San Francisco Fed. And Fed Chairman Jerome Powell earlier this month expressed a preference for a more short-term oriented measure that measures 3-month rates versus expectations for 3-month rates 18 months in the future.
The 3-month/10-year spread, meanwhile, is “far from inverted,” Mayfield noted.
See: Stock-market investors should watch this part of the yield curve for the ‘best leading indicator of trouble ahead’
Indeed, the divergence between the two closely followed measures of the curve has been a head scratcher for some market watchers.
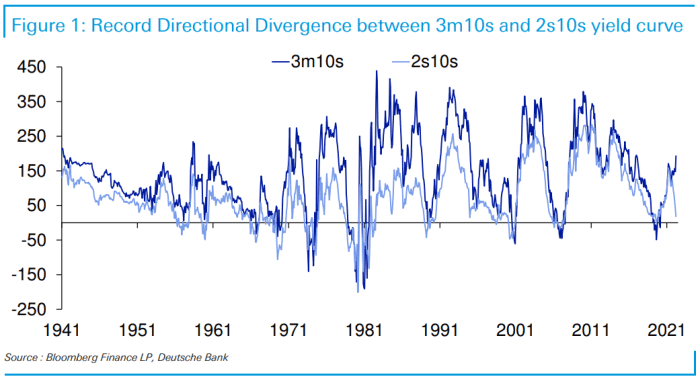
“The remarkable thing is that the two have always gone hand in hand directionally until around December 2021 when 3m/10s started to steepen as 2s/10s collapsed,” said Jim Reid, strategist at Deutsche Bank, in a Tuesday note (see chart below).
Deutsche Bank
“There has never been such a directional divergence possibly because the Fed [has] never been as behind the ‘curve’ as they are today,” Reid said. “If market pricing is correct, they will rapidly catch up over the next year so it’s possible that in 12 months’ time” the 3-month/10-year measure will be flat as short-term rates rise as the Fed hikes its benchmark policy rates.
The takeaway, Mayfield wrote, is that the yield curve remains a powerful indicator and is at the very least signaling a cooling economy.
“Volatility should remain heightened and the bar for investing success is raised. But in the end, we think it is worth taking the time to digest the larger picture and not rely on any single indicator,” he said.
In One Chart: ‘The dam finally broke’: 10-year Treasury yields spike to breach top of downward trend channel seen since mid-1980s