Investing in Russia means investing in oil and natural gas. And with demand for both rising as the world economy recovers from the coronavirus pandemic, a play on Russia may serve investors well, despite the festering conflict over Ukraine.
Russian stocks have pulled back significantly over the past three months, but the decline has been based almost entirely on investors’ sentiment — the forward earnings estimates have hardly budged. Factoring in the long-term nature of conflict between Russia and Ukraine, and how tensions have settled previously, this might be an excellent buying point for investors with an appetite for risk.
Below is information about two exchange-traded funds that track Russia’s stock market in different ways, along with screens of the largest holdings of each.
The setup
Analysts at Pictet Wealth Management led by Julian Holtz wrote in a report on Jan. 27 that based on previous conflicts involving Russia, including the 2014 annexation of Crimea (which had been part of Ukraine since Ukraine’s independence from the Soviet Union in 1991), “[a] scenario à la 2014 would imply limited, single-digit (8%) downside from here.”
Pictet Wealth Management is a unit of Pictet Group of Geneva, which had about $ 664 billion in assets under management as of the end of 2020, based on current exchange rates.
Holtz went on to write: “We could see significant upside potential for the MSCI Russia [Index] over a couple of months should a de-escalation scenario materialize (~35% in USD terms).”
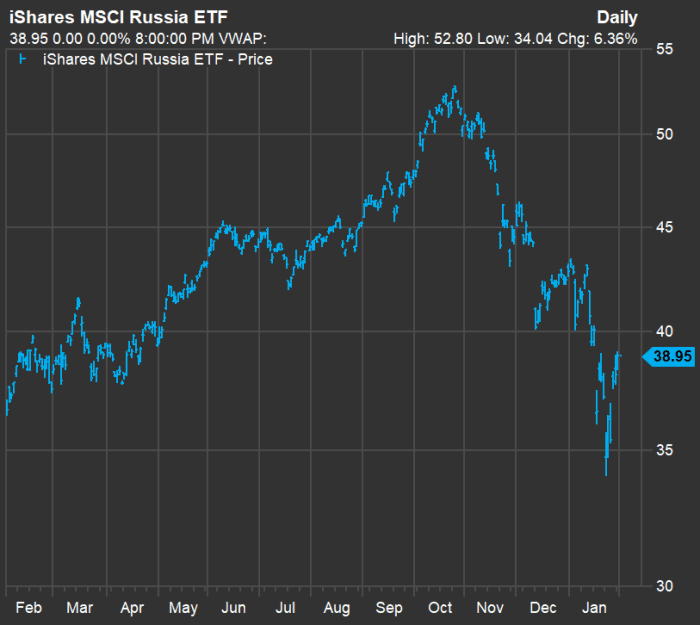
Russia might be considered an opaque market to most U.S. investors. But an easy way to invest there is through the $ 473 million iShares MSCI Russia ETF ERUS, +1.03%, which tracks the MSCI Russia 25/50 Index. Here’s how the exchange traded fund’s price has moved over the past year through Jan. 31:
FactSet
From its intraday peak at $ 52.80 on Oct. 26, ERUS was down 26% through Jan. 31 to $ 38.95. Meanwhile, the price of continuous forward-month contracts for Brent Crude Oil BRN00, +0.22% increased 4% to $ 89.26 on Jan. 31 from $ 85.65 at the close on Oct. 26. At the same time, the consensus 2022 EPS estimate for ERUS, based on weighed aggregate estimates among analysts polled by FactSet, increased slightly to $ 7.98 from $ 7.97.
Holtz wrote that the decline for the MSCI Russia Index was “fully attributable to valuations, whereas high energy prices have kept earnings expectations steady.”
He acknowledged currency risk, as Russia could allow the rubble to fall in value, relative to the dollar, to defend its economy in the event of steep sanctions. Then again, he believes downside risk for the ruble is limited because of “Russia’s structural current account surplus (which should remain elevated because of the high oil price and a weak ruble), its low public debt and high FX reserves as well as the Bank of Russia’s credibility.”
As if to underscore how important Russia is as a supplier of fuel to Europe, the Moscow Times reported on Tuesday that Gazprom PSJC RU:GAZP had doubled its Ukraine natural gas pipeline capacity in January.
Screening Russian stocks
Russia’s economy and stock market are dominated by the production and export of oil and natural gas. And the iShares MSCI Russia ETF is heavily concentrated, with the top five holdings making up 56% of the portfolio of 26 stocks. FactSet explains that this concentration gives market-like exposure to Russia, as it is “incredibly top-heavy.” Five of the top 10 holdings of ERUS are oil and/or natural gas companies making up 47% of the portfolio.
Another large ETF with a different approach to the Russian market is the $ 1.2 billion VanEck Russia ETF RSX, +1.13%. It holds 29 stocks and is far less concentrated, with the top five holdings making up 37.5% of the portfolio. According to FactSet, RSX “doesn’t necessarily look like the broad Russian equity space” because of its greater diversification and limitation to exposure to the energy industry. Then again, among its top 10 holdings, five are oil and/or natural gas companies, and these make up 35% of the portfolio.
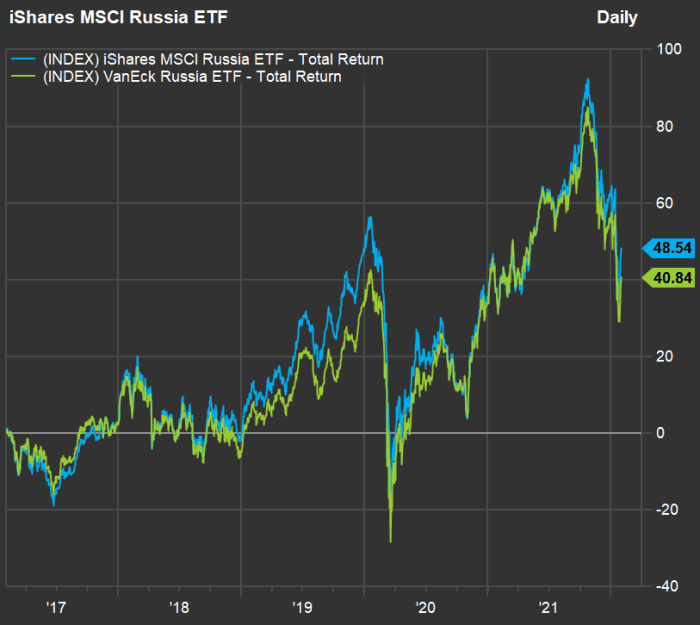
Here’s a chart comparing the two ETFs, showing a similar pattern but better performance for ERUS over the past five years through Jan. 31:
FactSet
Most of the stocks held by ERUS trade locally, while most held by RSX are American depositary receipts (ADRs) or global depositary receipts (GDRs) traded in the U.K or U.S.
The following are lists of the top 10 holdings of each ETF, along with summaries of opinion among analysts polled by FactSet. Share prices are in locally traded currencies.
First, here are the top 10 holdings of the iShares MSCI Russia ETF (ERUS):
| Company | Ticker | Share of ERUS portfolio | Share “buy” ratings | Closing price – Jan. 31 | Cons. price target | Implied 12-month upside potential |
| Gazprom PSJC | RU:GAZP | 19.8% | 94% | 334.80 | 504.95 | 51% |
| Lukoil PJSC | RU:LKOH | 14.3% | 87% | 6,878.00 | 8,603.92 | 25% |
| Sberbank Russia | RU:SBER | 11.9% | 94% | 264.50 | 430.25 | 63% |
| Norilsk Nickel Mining & Metallurgical Co. | RU:GMKN | 5.3% | 36% | 21,916.00 | 25,831.21 | 18% |
| Novatek JSC GDR | NVTK, +1.62% | 4.9% | 67% | 209.90 | 277.98 | 32% |
| Tatneft PJSC | RU:TATN | 4.3% | 69% | 499.70 | 701.42 | 40% |
| TCS Group Holding PLC GDR | TCS, +3.29% | 3.9% | 53% | 71.20 | 93.20 | 31% |
| Rosneft Oil Co. | RU:ROSN | 3.6% | 79% | 576.95 | 795.62 | 38% |
| Yandex N.V. Class A | YNDX, +0.96% | 3.1% | 100% | 48.06 | 84.91 | 77% |
| Polyus PJSC | PLZL-RU | 2.6% | 55% | 12,230.00 | 16,884.18 | 38% |
| Source: FactSet | ||||||
On the above list of ERUS’s top holdings, all the stocks are locally traded in Russia, except for the two GDRs traded in the U.K. (as indicated by the “UK:” in the tickers) and Yandex N.V. YNDX, +0.96%, which is listed in the U.S.
And here are the top 10 holdings of the VanEck Russia ETF (RSX):
| Company | Ticker | Share of RSX portfolio | Share “buy” ratings | Closing price – Jan. 31 | Cons. price target | Implied 12-month upside potential |
| Gazprom PJSC ADR | OGZD, -0.35% | 8.5% | 100% | 8.63 | 13.27 | 54% |
| Lukoil PJSC ADR | LUKOY, +2.14% | 8.0% | 86% | 88.87 | 113.62 | 28% |
| Sberbank Russia PJSC ADR | SBRCY, +0.11% | 7.6% | N/A | 13.67 | N/A | N/A |
| Novatek JSC GDR | NVTK, +1.62% | 6.8% | 67% | 209.90 | 277.98 | 32% |
| Norilsk Nickel Mining & Metallurgical Co. ADR | MNOD, +1.81% | 6.6% | 40% | 28.12 | 34.04 | 21% |
| Tatneft PJSC GDR | ATAD, -0.13% | 6.1% | 69% | 38.38 | 57.26 | 49% |
| Rosneft Oil Co. GDR | ROSN, +1.40% | 5.4% | 85% | 7.41 | 10.81 | 46% |
| TCS Group Holding PLC GDR | TCS, +3.29% | 4.3% | 53% | 71.20 | 93.20 | 31% |
| Polyus PJSC GDR | PLZL, +2.31% | 3.9% | 55% | 78.00 | 111.69 | 43% |
| Polymetal International PLC | POLY, +1.93% | 3.5% | 72% | 10.61 | 16.57 | 56% |
| Source: FactSet | ||||||
Click on the tickers for more about each company.
Click here for Tomi Kilgore’s detailed guide to the wealth of information available for free on the MarketWatch quote page.
Don’t miss: These 7 semiconductor stocks may be close to a bottom. This chart pattern shows when and how much they might rebound.