Semiconductor stocks have been hit hard since the industry group rose to a record in early January. Analysts at Jefferies see a “peaking” pattern similar to those of 2014-2015 and 2017-2018, and expect excellent performance for some during what they call “mini-upcycles.”
Below is a list of seven semiconductor stocks the analysts, led by Mark Lipacis, believe might be best to own through this cycle.
A pattern to follow
Here are three charts to illustrate these patterns, based on price action for the iShares Semiconductor ETF SOXX, +2.96%, which tracks the performance of the PHLX Semiconductor Index SOX, +2.89% of 30 stocks.
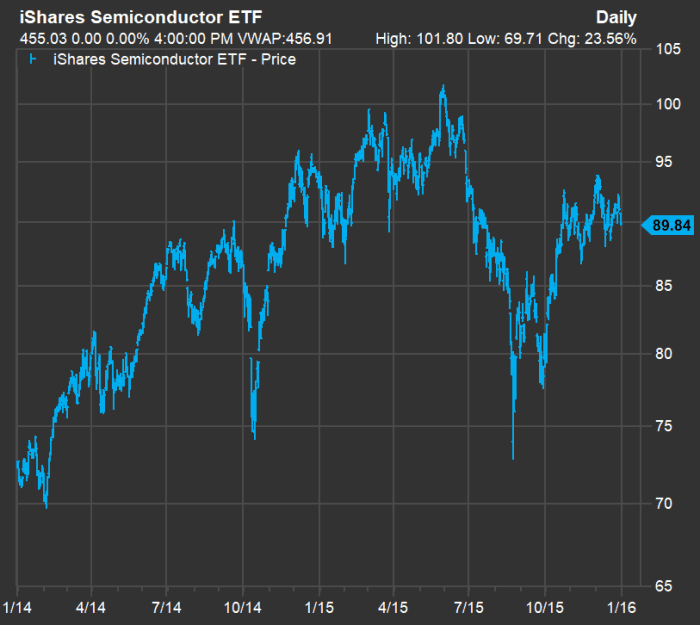
The first chart runs from the end of 2013 through the end of 2015:
FactSet
You can see the repeat pattern of peaks, pullbacks and rebounds.
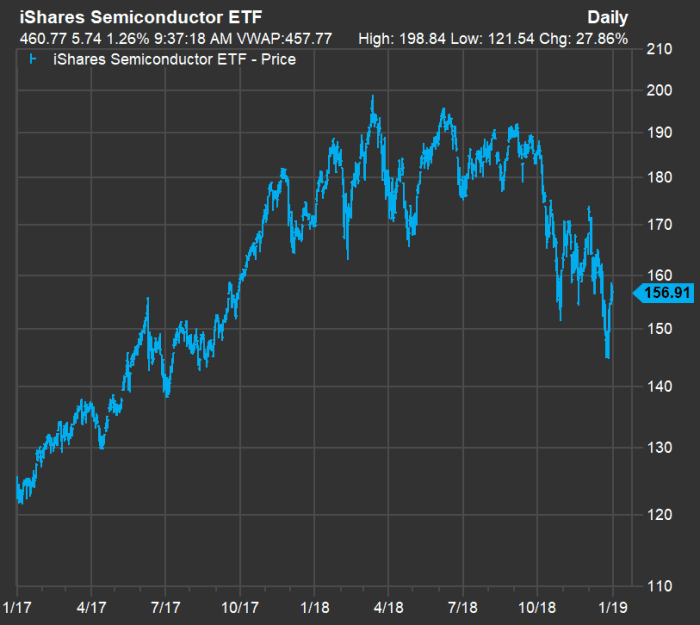
Here’s the action for SOXX from the end of 2016 through the end of 2018:
FactSet
Once again, we see the pattern of “repeat peaks” for SOXX.
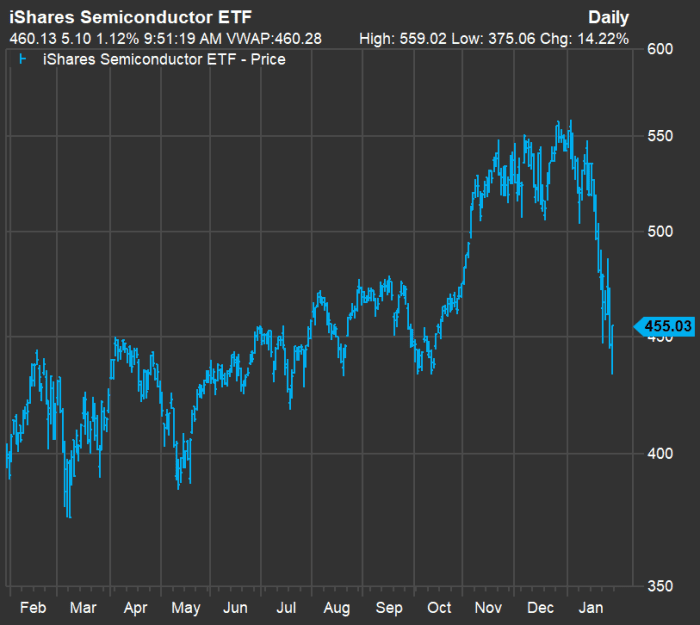
Now look at a one-year chart for SOXX through the close on Jan. 28:
FactSet
In a note to clients on Jan. 31, Lipacis called the current pattern, with SOXX down 19% from its intraday high at $ 559 on Jan. 4 through the close at $ 455 on Jan. 28, another “peaking process.”
His analysis of the previous two times this happened indicates that there are “multiple mini-peaks and troughs” that typically last 45 days. So we may still be at an early stage for the current mini-cycle.
Lipacis went on to write that semiconductor stocks can swing plus or minus 40% during these periods and that “the stocks that do the worst during the mini-downcycles usually do best during the mini-upcycles, which suggests owning” the following seven, “especially after recent weakness.”
| Company | Ticker | Price decline – 2022 | Decline from 52-week high | Closing price – Jan. 28 | 52-week high | Date of 52-week high |
| Nvidia Corp. | NVDA, +4.12% | -22% | -34% | $ 228.40 | $ 346.47 | 11/22/2021 |
| Advanced Micro Devices Inc. | AMD, +5.63% | -27% | -36% | $ 105.24 | $ 164.46 | 11/30/2021 |
| Microchip Technology Inc. | MCHP, +4.90% | -17% | -20% | $ 72.22 | $ 90.00 | 12/28/2021 |
| Marvell Technology Inc. | MRVL, +4.00% | -24% | -29% | $ 66.32 | $ 93.85 | 12/08/2021 |
| Lam Research Corp. | LRCX, +2.24% | -22% | -23% | $ 561.14 | $ 731.85 | 01/04/2022 |
| NXP Semiconductors N.V. | NXPI, +5.19% | -17% | -21% | $ 189.45 | $ 239.91 | 12/07/2021 |
| ON Semiconductor Corp. | ON, +6.72% | -21% | -25% | $ 53.76 | $ 71.26 | 01/04/2022 |
| Sources: Jefferies, FactSet | ||||||
You can click on the tickers for more about each company.
Then read Tomi Kilgore’s detailed guide to the wealth of information available for free on the MarketWatch quote page.
Long-term performance: SOXX vs. S&P 500
To be sure, the above suggestion from Jefferies, within what may be a repeat pattern of peaks and troughs for this cycle, would be a tactical trade.
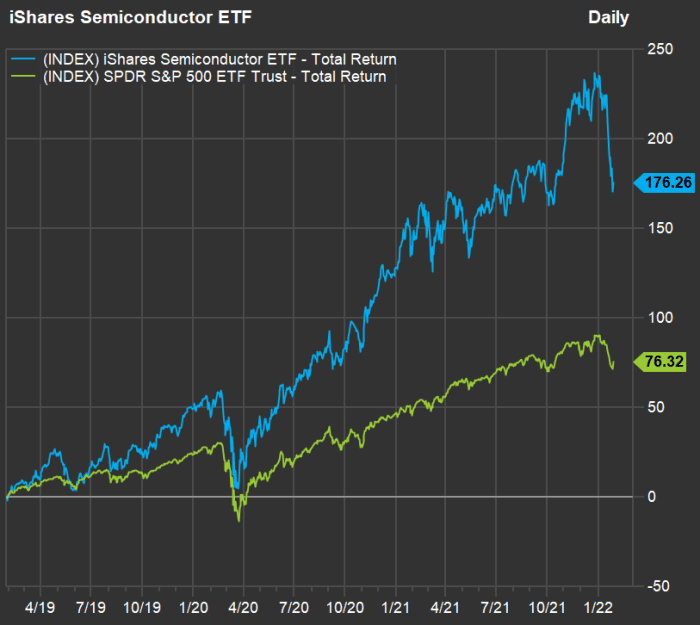
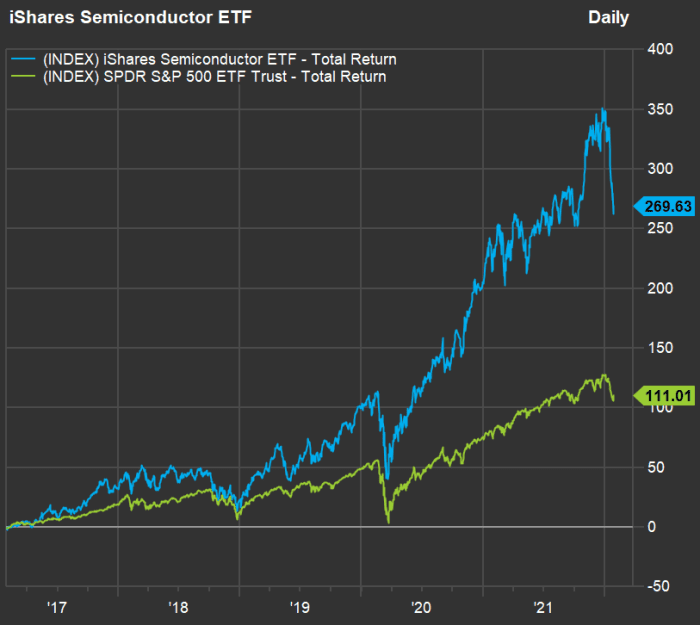
For long-term investors, the performance of SOXX against the S&P 500 Index SPX, +0.54%, tracked by the SPDR S&P 500 ETF Trust SPY, +0.49%, has been nothing short of breathtaking. Here’s a three-year total-return chart, with dividends reinvested, through Jan. 28:
FactSet
Now five years:
FactSet
And 10 years:
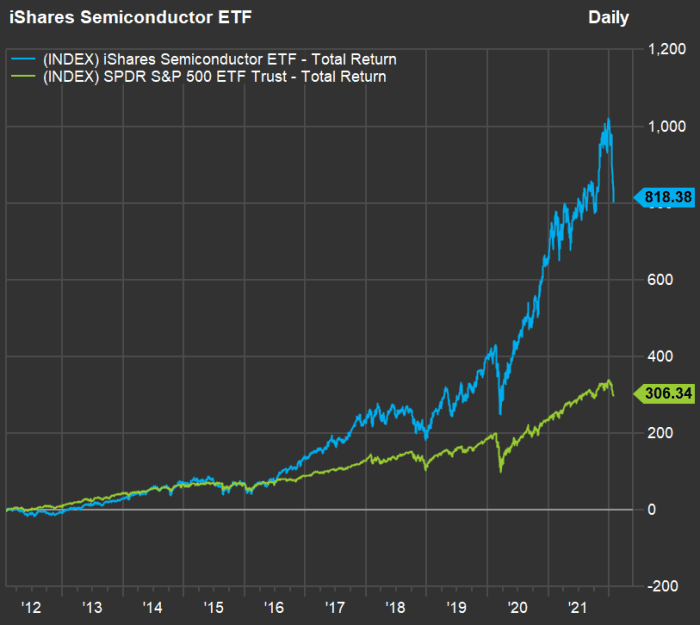
FactSet
A look ahead: SOXX vs. SPY
One reason for SOXX’s long-term relative outperformance is that the semiconductor industry has been growing sales and earnings more rapidly than the broad market.
Here are expected compound annual growth rates (CAGR) for sales per share (SPS) for SOXX and SPY for the next two and three calendar years, based on consensus estimates among analysts polled by FactSet:
| ETF | Two-year expected sales CAGR | Three-year expected sales CAGR | Est. SPS – 2021 | Est. SPS – 2022 | Est. SPS – 2023 | Est. SPS – 2024 |
| iShares Semiconductor ETF | 10.3% | 10.2% | $ 78.83 | $ 88.94 | $ 95.88 | $ 105.45 |
| SPDR S&P 500 ETF Trust | 6.4% | 6.7% | $ 153.46 | $ 164.59 | $ 173.57 | $ 186.43 |
| Source: FactSet | ||||||
Here’s the same comparison, based on earnings-per-share estimates:
| ETF | Two-year expected EPS CAGR | Three-year expected EPS CAGR | Est. EPS – 2021 | Est. EPS – 2022 | Est. EPS – 2023 | Est. EPS – 2024 |
| iShares Semiconductor ETF | 11.5% | 10.5% | $ 22.56 | $ 25.45 | $ 28.03 | $ 30.45 |
| SPDR S&P 500 ETF Trust | 9.5% | 9.7% | $ 20.47 | $ 22.34 | $ 24.53 | $ 27.00 |
| Source: FactSet | ||||||
Don’t miss: 24 software stocks, including Microsoft, expected to rise by double digits over the next year