Ashish Kyal is Founder of WavesStrategy.com and Ashish Kyal Trading Gurukul
Bank Nifty is following an Advanced Elliott wave – Neo wave pattern amazingly well and when this is combined with Bollinger Bands, Channels and Candlestick, it is possible to forecast with high accuracy.
Elliott wave becomes very useful during major reversals and gives us high conviction trade setups. See the below research which clearly highlights this fact.
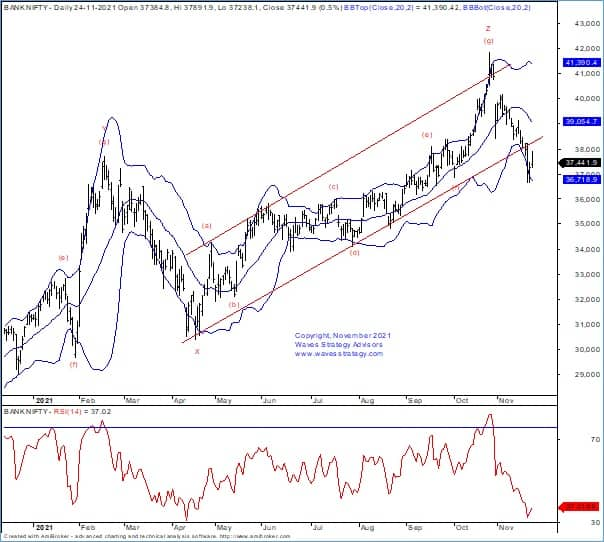
Bank Nifty daily chart:
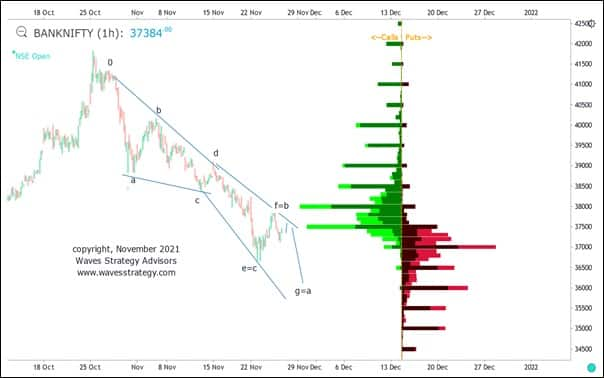
Bank Nifty hourly chart with Open Interest Profile
Elliott wave analysis
On the daily chart, we can see that after completing minor wave ‘g’ near 41,800 level, sharp fall has been witnessed, which suggests that intermediate wave ‘Z’ might have completed. Prices have made an attempt to bounce from the support of lower Bollinger band. However, till we do not see close above middle bands, we can expect weakness to persist. Looking at the break of upward rising channel support, it is high likely that the trend can remain in sell on rise mode.
Bank Nifty Hourly chart Diametric pattern with Open Interest profile
Bank Nifty has been forming precise diametric pattern which is a 7-legged correction. This pattern is described in Neo wave with all legs corrective in nature. Forecasting can be done as per following relationship between each of the legs as follows:
Wave g = wave a
Wave f = wave b
Wave e = wave c
The above is a guideline and helps a trader to trade accordingly. We are combining Open Interest profile as well along with it for high conviction trade setups.
Open interest profile: It suggests that there is highest Call open interest at 38,000 levels and highest change in Call OI is at 37,500 and so crossing this zone can be challenging, whereas on the downside 37,000 has the highest Put OI and also the change. It seems that for bears to take back control we have to see decisive break below 37000 levels and for the up move break above 38,000 is must.
Now that we have these crucial open interest data and Elliott wave pattern, it seems that there can be a minor pullback but not necessary post which Bank Nifty can start moving lower again towards 36,400 – 36,000 levels which is a target as per the diametric pattern and also minor open interest support.
In a nutshell, above research clearly shows that by knowing about Elliott wave, Neo wave patterns and combining open interest data, one can form excellent trading strategy either in Options or Futures. Many are focussing only on Options without knowing the market outlook which will not yield into any profitable outcome. It is therefore important for traders to focus on understanding these simple and easy techniques and then form Option strategies.
Disclaimer: The views and investment tips expressed by investment experts on Moneycontrol.com are their own and not that of the website or its management. Moneycontrol.com advises users to check with certified experts before taking any investment decisions.