There’s a lot more investors can glean from a MarketWatch stock quote page than just the price and the change from the previous session. In fact, price may be one of the least useful research data available.
Of course, you may want to know what is driving a big change in the stock price. Type a company’s ticker symbol or name into the search field on MarketWatch.com to get the stock page (also called a ticker page) and look under the “overview” tab for reports from MarketWatch and other Dow Jones publication as well as company news releases and reports from some other contributors.
But to become a smarter investor, you need to look at both the stock price and the underlying metrics used to evaluate a company and stock against both peers and over time.
One way to do that is by using an “advanced” or “interactive” chart, which can be found on the MarketWatch quote page. The charts can extend the time viewed to more than 10 years, and can overlay, or provide in a lower chart, a number of technical or fundamental metrics. It also lets you compare the moves to other stocks and indexes.
Here are 10 things more important than price that are available to investors, listed in alphabetical order:
52-week high and low
A stock’s 52-week high or low is a price range that helps an investor see where the stock is trading relative to how it has traded over the past year. It can be found under the “overview” tab in a quote page.
Although some might view a stock trading closer to its low over the past year as relatively cheap, Art Hogan, chief market strategist at National Securities Corp., said he would prefer to invest in a stock that is trading closer to its 52-week high than its 52-week low.
“I’m not looking at what the market is getting wrong, I’m looking at what the market is getting right,” Hogan said. “It’s near its high for a reason.”
Analysts’ estimates for EPS and revenue
Michael O’Rourke, chief market strategist at JonesTrading, likes to check the change in analyst expectations for full-year earnings per share and revenue, as that can provide a view on how Wall Street perceives the underlying strength of a company’s business.
Those and more can be found under the “analyst estimates” tab on a quote page.
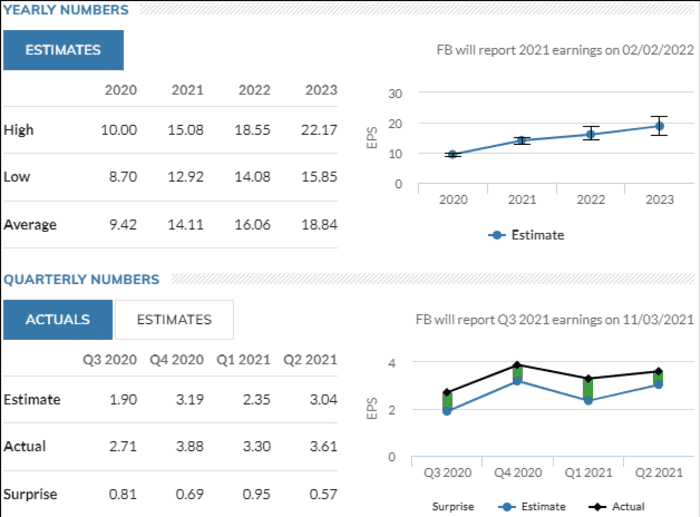
A look at the yearly numbers shows the EPS estimates for the current year as well as for the next two years, as compiled by FactSet, in both table form and as a chart. The page also shows how what a company reported on a quarterly basis compared with the average analyst EPS estimate, overall analyst ratings of a company and how the ratings have changed over the past three months, and the average stock price target and notable changes in ratings and targets.
For example, Facebook Inc.’s FB, +0.26% full-year EPS was expected to keep growing at a steady rate as of the start of the third quarter of 2021, and its reported quarterly EPS beat expectations in the previous four quarters.
Facebook Inc.
MarketWatch
Competitors
It’s smart to compare a company’s financial performance against its competitors when assessing its financial performance. Scroll to the bottom of the “overview” page to find that list — companies in the same business and in some cases others in a similar broadly defined sector and within the same market-capitalization tier.
Dividend yield
Also on the “overview” page is the dividend yield, or the annual dividend rate per share divided by the stock price. It is best viewed relative to a company’s peers, the broader stock market and the yield on the 10-year Treasury note. BX:TMUBMUSD10Y
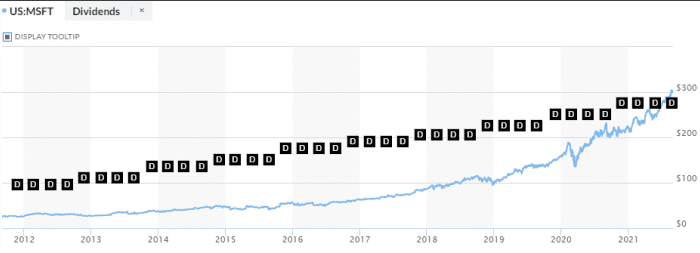
For example, Microsoft Corp.’s MSFT, -0.00% dividend yield as of the end of August 2021 was a little over half that of the S&P 500 and the 10-year Treasury yield. However, the yield is above that of Apple Inc. AAPL, +0.42%, the only other company with a larger market cap, and above the yield of the SPDR Technology Select Sector exchange-traded fund XLK, +0.40%.
MarketWatch, BigCharts
To see if the company has consistently paid a regular dividend, select “dividend” under the “events” tab.
Free cash flow
Free cash flow is the cash generated from operations after expenses and capital investments. The more cash available to a company, the more it can spend to expand. It can be found under the “financials” tab, then click on the secondary “cash flow” tab.
How free cash flow changes over time is useful in judging the current strength of a company’s business and its potential for growth, said Paul Nolte, portfolio manager at Kingsview Investment Management.
The MarketWatch quote page provides a scale to see the change in free cash flow on an annual basis over the past five years or over the past five quarters.
For example, free cash flow (FCF) was a key metric analysts used to evaluate General Electric Co. GE, -1.42%, as the company recovered from years of financial distress. The quote page shows how FCF turned positive in 2019 after being negative the previous three years and that it stayed positive in 2020.
To become a better investor: sign up for a MarketWatch newsletter here.
Gross profit margin
Gross profit margin, and the change over time, is another important measure of a company’s profitability. That can be found under the “financials” tab on a quote page.
Gross profit margin is calculated by dividing gross income — sales minus cost of goods sold (COGS) — by sales. It should be viewed over time and relative to its peers.
For example, the year-over-year growth rate for Microsoft’s revenue has been higher than the COGS growth rate the past four years, which indicates that gross profit margin has improved in each of the past four years.
Microsoft’s 2020 gross profit margin also was more than double the S&P 500’s implied gross profit margin and nearly double that of Apple and Amazon.com Inc. AMZN, +0.43%
P/E ratio
The price-to-earnings ratio, or P/E ratio, is one of the favorite metrics of JonesTrading’s O’Rourke. It is the price of the stock divided by earnings per share, gives investors a way to see what they’re paying for each $ 1 on a company’s bottom line, and to compare that cost over time and with a company’s peers.
To find it, click on the “profile” tab in a stock’s quote page.
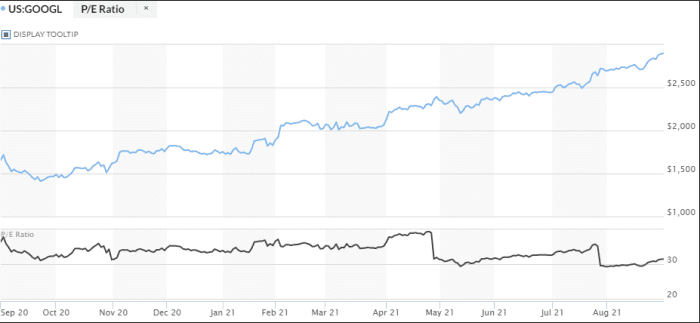
For example, Google parent Alphabet Inc.’s stock GOOGL, +0.32% GOOG, +0.39% may at first glance appear to be a bit rich, given that it has advanced at triple the pace of an already booming S&P 500 through the first eight months of 2021.
In terms of P/E, Alphabet’s could make the stock appear expensive, since it was about 6 percentage points above the implied P/E ratio for the S&P 500.
But despite the big gain in the stock price, Alphabet’s P/E had declined by more than 2 percentage points since the end of 2020 as earnings have increased at a faster rate than price. Looking at it compared against other technology companies, it was several percentage points below Microsoft’s and a little more than half that of Amazon’s but a little above Apple’s P/E.
To chart the P/E, go to “advanced chart” and then within the “lower charts” pull-down menu, select “P/E Ratio.”
MarketWatch, BigCharts
Price-to-sales ratio
Price relative to sales is similar to the P/E ratio, but because it is based on the top line rather than earnings per share, the ratio can’t be influenced by a change in the number of shares outstanding from share repurchases.
“The higher you go up on the income statement, the harder it is [for a company] to mess around,” said Kingsview’s Nolte.
Return on invested capital
Return on invested capital (ROIC) is calculated by dividing net operating profit, after tax, by invested capital. It’s way to judge how well a company’s management allocates capital to generate a return. That can be found under the “profile” tab on a quote page.
For example, Apple’s ROIC was a few percentage points above the S&P 500’s performance over the past 12 months, and nearly triple that of the 10-year Treasury yield.
“One of the most important [metrics I look at] is return on invested capital,” National Securities’ Hogan said. “Anything more than 15% is spectacular.
Short interest as a percent of float
Short interest is the number of shares that have been bet by investors that the stock price will decline, while the percent of float is short interest divided by the number of shares publicly available for trade. That can be found under the “overview” tab.
Short interest is a good way to gauge overall investors sentiment in a stock. It is often used as a contrarian indicator; the more short interest there is, the more shares that will have to be purchased to cover those shorts if prices rise enough for bears to abandon their bets or fall enough for bears to take profits.
Don’t miss: Short sellers are not evil, but they are misunderstood.
So a stock with a high relative short interest ratio and that is trading close to its 52-week high may have more potential for gains than a stock with a low short interest ratio trading near its 52-week low.
There is also the potential of a “short squeeze,” for heavily shorted stocks, which include meme stocks AMC Entertainment Holdings Inc. AMC, -0.81% and GameStop Corp. GME, -5.04%
Keep going
There is a lot more on stock quote pages that can be very helpful in sizing up a company:
- Board of directors, under the “profile” tab, gives a quick view of people making decisions for the company.
- Look at liquidity ratios, also under the “profile” tab. The current ratio is a measure of a company’s ability to pay short-term debt obligations; the quick ratio, also known as the acid-test ratio, provides a look at assets easily convertible to cash; and the cash ratio depicts a company’s ability to use available cash to pay off short-term debt.
- Charts, under the “charts” tab, provide an easy way to gauge a stock’s performance over time. The charts allow investors to change the frequency and type of display, while adding many technical studies such as moving averages, relative strength, volume and news density.
- The “financials” tab includes a look at the income statement and balance sheet over a five-year period. It also provides a list of a companies filings with the Securities and Exchange Commission.
- A list of tradable stock option contracts can be found under the “options” tab, with all available maturities and strike prices, and prices for both bullish “call” options and bearish “put” options.
- Employee data under the “profile” tab includes the number of employees, revenue per employee and income per employee.
- Multiple valuation measures are under the “profile” tab, such as total debt to enterprise value, enterprise value to sales, price to Ebitda (earnings before interest, taxes, depreciation and amortization), price to book ratio and price to cash flow ratio.
- The most recent insider transactions are under the “profile” tab.