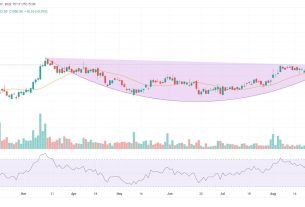
For the last two weeks, the Nifty has been stuck in a non-trending phase. It was a cumulative play of multiple factors like strained upmove, the underperformance of banks, profit booking in broader markets, presence of multiple hurdles around 15,900 zone. This week’s drop from day’s high in Nifty, BankNifty in Wednesday’s session & lack of any negative follow-through both on Thursday & Friday session highlights current congestion phase on Dalal Street.
An index grappling with congestion (15,400-15,900) invariably shows such contrasts movement. It is essential for Nifty to stage a decisive move above multiple supply points between 15,850-15,900 to gain an upside momentum.
Downside momentum has not been strong enough, which highlights the influence of support at play. So, buying on declines theory has worked out well. Going ahead, on sustenance above 15,900, Nifty could dash towards a three-digit Gann number of 163(00).
Going by the action of the last two sessions, the market is clearly attempting to sustain at the top now. This week, Nifty found support around the midpoint of the entire move from the previous Friday’s low to this week’s high, implying immediate support around 15,650 zone.
The previous two sessions have seen banks making a strong comeback. The ratio of the leadership index versus Nifty reversed from the support of its 200-DMA. Also, the pattern of higher lows continues to be intact on the ratio. Pullback & phase of outperformance is likely to set in within the banks. On the standalone chart, BankNifty has held on to point of polarity zone and its 100-DMA. Following a period of sideways correction, it has staged a breakout above the short-term trendline. On point & figure (P&F) chart (0.25 percent *3), bear trap reversal and double top buy are seen which is followed by ABC breakout, suggesting a plausible move towards 37,000.
Post recent price correction, both Midcap 100 & Smallcap 100 indices have also bounced off the support zone. As per Friday’s EOD data, around 84 percent of Nifty Midcap 100 components are trading above its 50-DMA; so, breadth has bounced in last one week. On June 18, there was around 80 percent of stocks from the midcap basket, trading above the same moving average. So, price improvement from the previous Friday’s low has been accompanied by improved breadth.
Nifty IT index dominated headlines last week, rallying by 2.7 percent. P&F Ratio of IT versus Nifty shows an anchor column follow through (bullish), suggesting the continuation of IT’s outperformance against Nifty.
The ratio of Nifty Composite G-Sec Index versus Nifty50 continues to trend lower, implying underperformance of bonds versus equities. Bearish anchor columns and multiple double bottom sell signal indicate the continuation of the ongoing trend.
Disclaimer: The views and investment tips expressed by investment expert on Moneycontrol.com are his own and not that of the website or its management. Moneycontrol.com advises users to check with certified experts before taking any investment decisions.