As long as 15 minutes cycle’s low near 14415 is protected, prices can show range-bound movement with a positive bias. A break below 14,415 will suggest cycles are entering into a sell zone, which can take it lower towards the earlier support area of 14,200.

Time Cycles is a powerful technical analysis study that can give a clear reversal area to traders. So many times even after knowing the trend, it gets difficult to make money because the timing is off by just an hour. Here is the solution to that problem—time the trade precisely to the very minute.
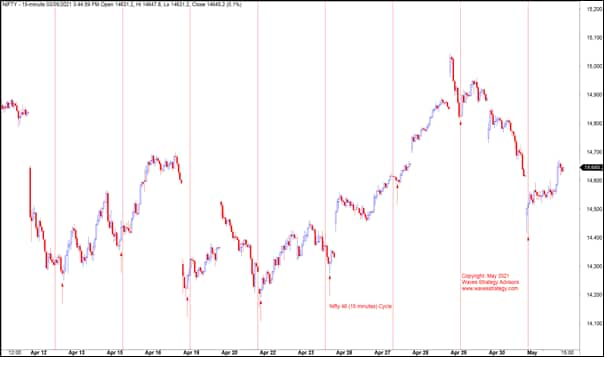
Look at the following charts of Nifty on 15-minute and 5-minutes time frames. Also, keep in mind that both the charts show a synchronised time behaviour.
Nifty 15 minutes Chart (46 period Time cycle)
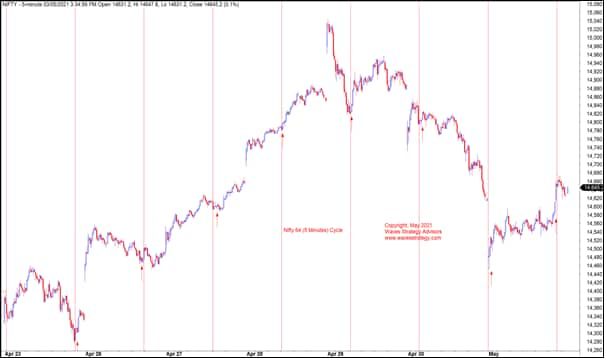
Nifty 5 minutes Chart (64 period Time Cycle)
The above chart highlights areas of reversal and again these are not big time frame charts but 15 minutes and 5 minutes. Now, this can be an eye-opener for every trader that news or events are not responsible for the movement of the market but the market behaves the way it has to and news will align itself along with it.
The Nifty 15 minutes chart shows a 46 period time cycle—we can see that every 46 periods with a few candles leeway prices reverse the trend from down to up.
It has happened so precisely on many occasions to the very period and it suggests that by knowing this information, a trader can align their existing studies with the time period and enter the market exactly when it is supposed to reverse.
To make it more precise let us now drill down to the 5 minutes chart.
The Nifty 5 minutes chart shows a 64 periods Time Cycle—turn in prices is not only limited to 15 minutes time frame but also to a 5 minutes chart.
In the above chart, we have shown a clear reversal in trend for every 64 candles. Even the recent low near 14415 was exactly on this time cycle period. Thrilled yet!
Imagine the drastic rise in accuracy if one is aware of this simple concept of Time Cycles and learn the application of the same right to a 5 minutes chart.
In a nutshell, as long as 15 minutes cycle low near 14,415 is protected, prices can show range-bound movement with a positive bias. A break below 14415 will suggest cycles are entering into a sell zone, which can take it lower towards the earlier support area of 14,200.
Disclaimer: The views and investment tips expressed by experts on Moneycontrol.com are their own and not that of the website or its management. Moneycontrol.com advises users to check with certified experts before taking any investment decisions.

Ashish Kyal is Founder of wavesstrategy.com and Trading Gurukul. Follow on Twitter @kyalashish and YouTube channel @kyalashish